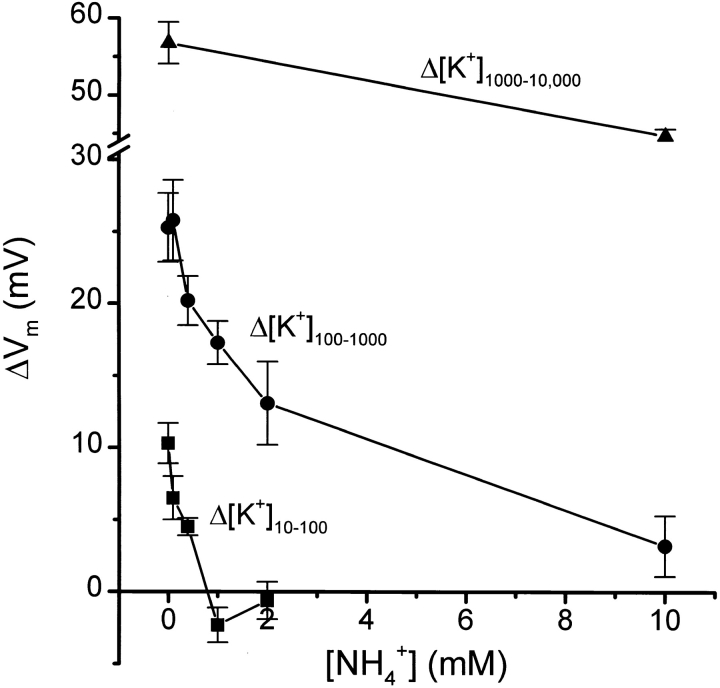
Figure 2.
Concentration dependence of the NH4 + inhibition of the K+ permeability of the akt1 root plasma membrane. Changes in steady state Vm produced by three different shifts in [K+]ext are plotted versus the NH4 + concentration present before and during the experiment. Note the axis break and change of scale for the 1,000–10,000 μM shift in [K+]ext. All values are the means of 6–10 independent experiments ± SEM.

