
Figure 8.
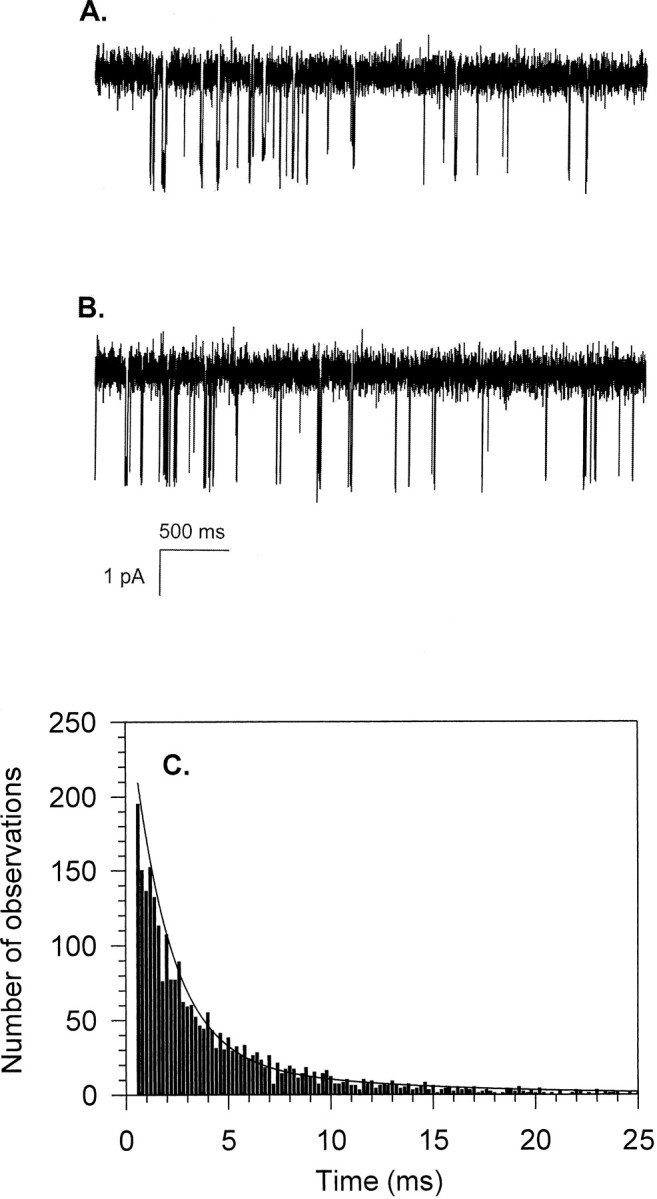
Comparison of single channel currents in the presence of 0.2 μM InsP3 and 0.1 μM free Ca. A represents an experimentally measured channel recording, whereas B represents a simulation, generated from the current mathematical model. C shows a dwell-time histogram obtained from 5 min of the simulated trace from which a representative stretch is shown in B. The open time distribution is accurately fit by a biexponential curve using the same parameters as for the experimental data shown in Fig. 5 B.