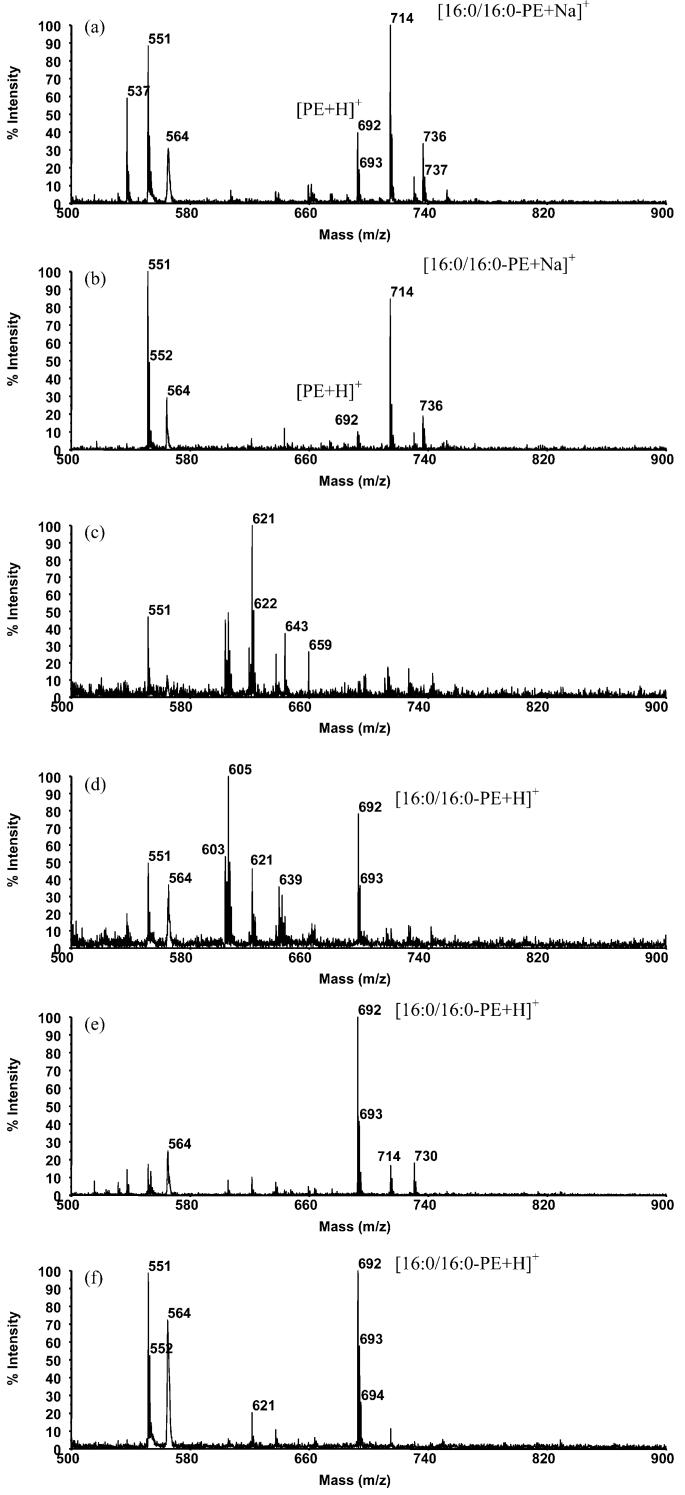
Figure 2.
Comparison of the six MALDI matrixes for the analysis of 16:0/16:0-phosphatidylethanolamine in positive ion mode. (a) DHB matrix showing predominant sodium adduct peak [PE + Na]+ at m/z 714 and minor [PE + H]+ at m/z 692. (b) α-CHCA/DHB plus TFA matrix with sodium adduct at m/z 714, but significant headgroup loss at m/z 551 observed, and a minor [PE + H]+ peak at m/z 692. (c) PNA matrix shows no appreciable signals for sodium adducts or protonated molecules. (d) PNA plus TFA producing [PE + H]+ at m/z 692, but major peaks for neutral losses of headgroup components at m/z 551, and m/z 605 are also observed. (e) PNA/butyric acid solid ionic crystal matrix producing predominantly the [PE + H]+ ion at m/z 692 with only very minor amounts of the sodium and potassium adducts at m/z 714 and m/z 730 and few fragment ions. (f) PNA/butyric acid plus TFA matrix producing the [PE + H]+ ion at m/z 692 as a major spectral peak, but also significant headgroup loss ions at m/z 551 and m/z 564.

