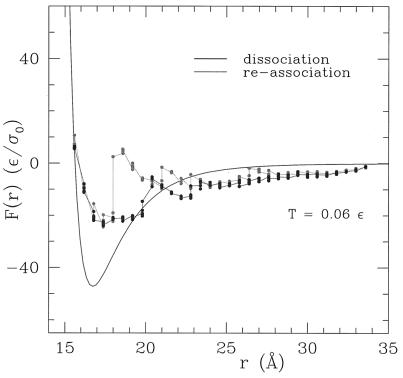
Figure 3.
Subunit dissociation (dark line) and reassociation forces (light line) as resulting from CMD simulations in which the two centers of mass of the two subunits are kept at fixed distance r. The forces are measured after equilibrium at temperature 0.06 ɛ has been reached. Multiple points, very close to each other, indicate repeated calculations and give an estimate of the error bar for the various measured forces. The static force, indicated by the black line, is the force between the monomers immediately after they are separated out at distance r from their native state. The force vs. r curve then is fitted with the function Ffit(r) = γ{(ρ/r)α1 − (ρ/r)α2} (best fit parameters γ = 20.8 ɛ, ρ = 2.4 σ0, α1 = 22.8, and α2 = 8.5, correlation coefficient among fitted and calculated values equal to 0.9998).

