
Figure 1.
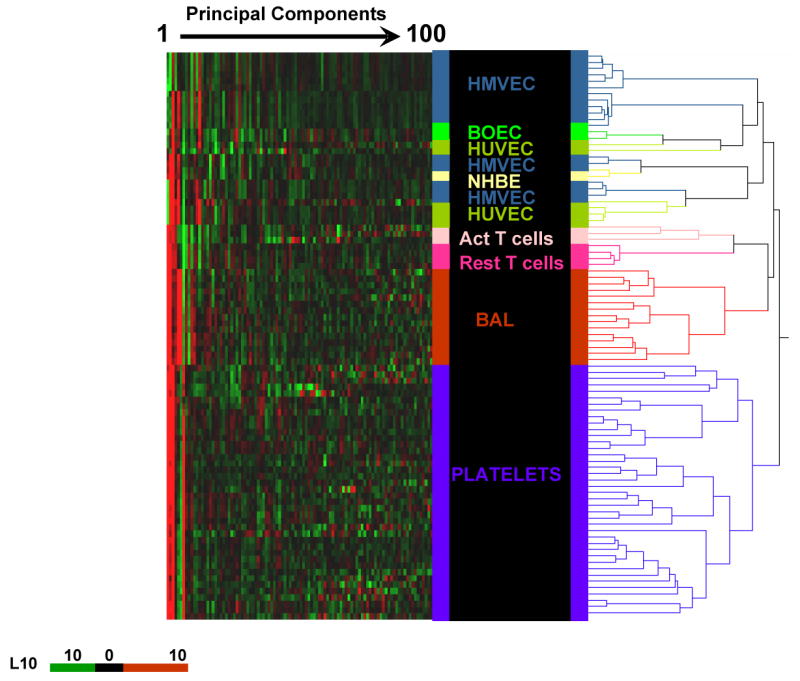
Principal component heat map analysis of the first 100 principal components representing 83% variability of 98 samples of different human cell types. Hierarchical cluster analysis was performed on transcriptome data derived from all samples in our database that were processed similarly by the 2-round amplification process and hybridized to HG-U133A or HG-U133 Plus 2.0 gene chips. Each principal component value for each sample is represented with a red, black, and green color scale. The dendrogram displays the clustering of samples according to their expression pattern and segregation of cell types of the same phenotype, thus revealing a distinct expression pattern for each of the cell types studied. HMVEC indicates human microvascular endothelial cells; BOEC, blood outgrowth endothelial cells; HUVEC, human umbilical vein endothelial cells; NHBE, normal human bronchial epithelial cells; PBMC, peripheral blood mononuclear cells; Act T, activated T lymphocytes; Rest T, resting T lymphocytes; and BAL, bronchoalveolar lavage cells.