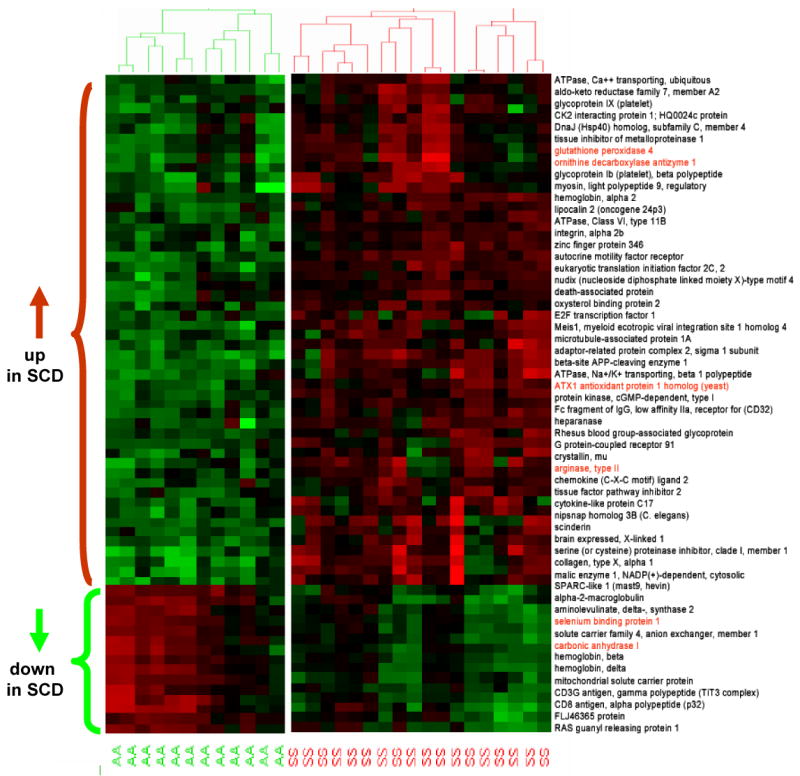
Figure 3.

Heat map of differential gene expression in platelets in sickle cell disease (SCD) compared with control subjects. Cluster analysis was applied to gene expression data derived from all probes on HG-U133 Plus 2.0 at a false-discovery rate of 5% and fold change (FC) >3.0 from 18 SCD patients (SS) and 12 control subjects (AA). The level of expression of each gene in each sample relative to the mean level of expression of that gene across all samples is represented with a red, black, and green color scale (green indicates below mean; black, equal to mean; and red, above mean). The dendrogram displays the unsupervised clustering of patients and control subjects using the differentially expressed gene list. Gene names are displayed on the right side of the figure, and genes of interest are highlighted.
