Figure 4.

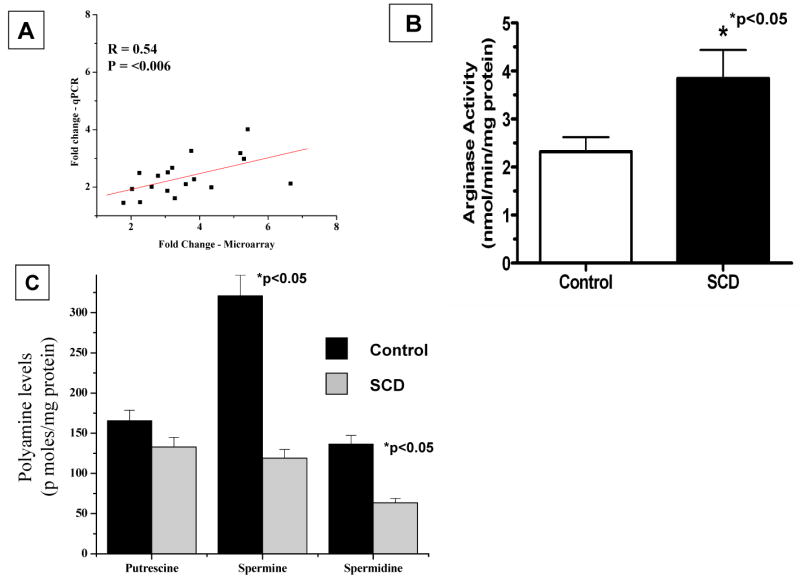
Modulation of arginase II mRNA abundance, arginase activity, and polyamine levels in platelets of patients with sickle cell disease (SCD). A, Correlation of fold change of arginase II mRNA abundance in SCD patients determined by microarray platform and TaqMan gene expression assay–based real-time polymerase chain reaction (PCR). X-axis represents log2-fold change determined by microarrays; y-axis represents log2-fold change determined by real-time PCR (qPCR). B, Platelet total arginase activity in SCD patients and control subjects. Arginase activity was determined as described in Methods. Values are expressed as mean±SD for 10 controls and 10 SCD patients. *P for comparison of SCD patients vs control subjects. C, Concentrations of polyamines in platelets from patients with SCD and control subjects. Polyamines were quantitated by high-performance liquid chromatography as described in Methods and are expressed as picomoles per milligram of protein (shown as mean±SD for 10 controls and 10 SCD patients). *P for comparison of SCD patients vs control subjects.
