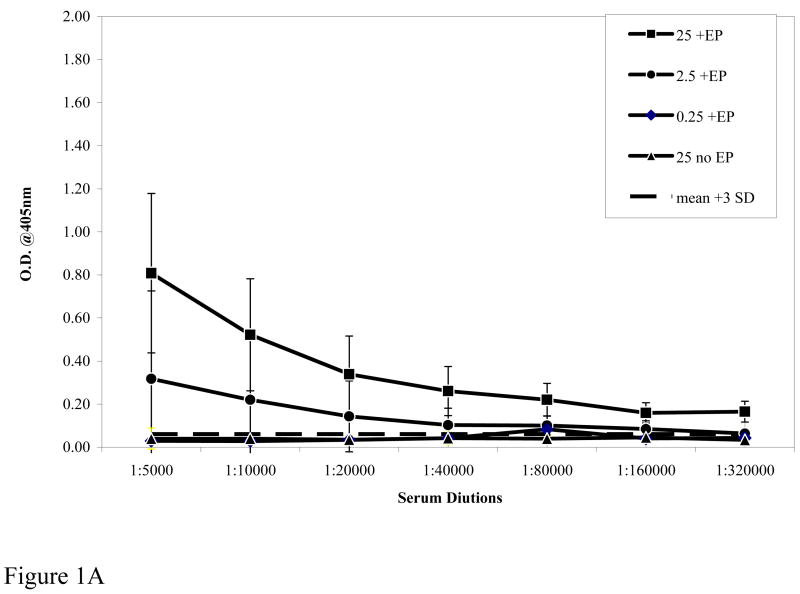
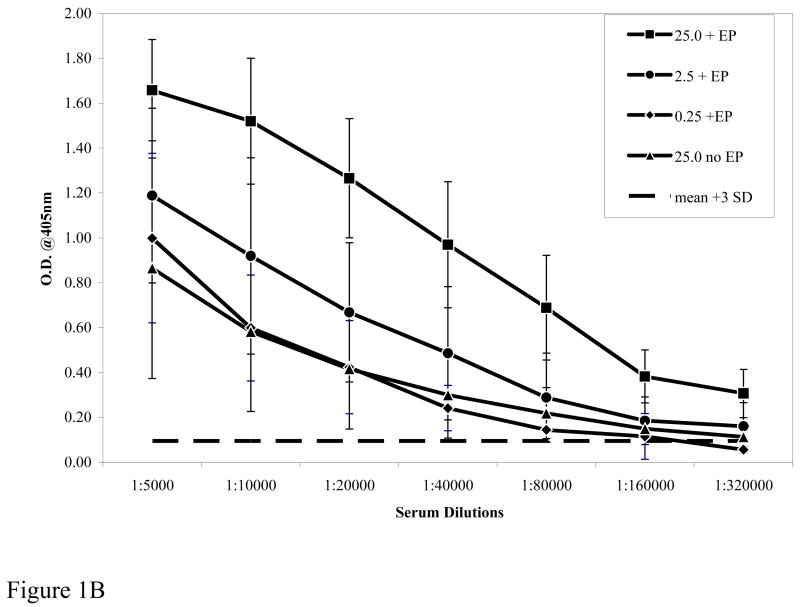
Figure 1A and 1B.
Antibody titers measured by ELISA to rPfs25. Figure 1A shows the serum dilution of antibody responses from pooled sera of immunized mice after prime and one boost. Dotted line represents pre-bleed mean plus 3 standard deviations used as a cut off. Figure 1B shows antibody response after prime and two boosts. The differences between 25μg plasmid dose with or without EP were significant at p<0.0.1 by ANOVA. Symbols: 25 μg +EP [filled square], 2.5μg +EP [filled circle], 0.25μg +EP [filled diamond], 25 μg No EP [filled triangle].


