Figure 3.
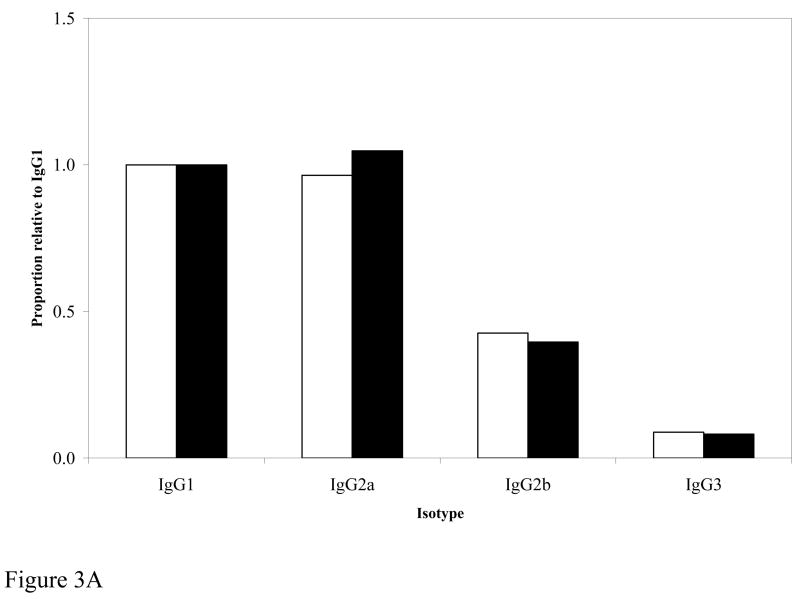
Figure 3A. Comparison of IgG isotypes. Pooled sera from mice immunized with 25 μg DNA with EP (white bars) or 25 μg NO EP (filled bars) were analyzed at 1:10,000 dilution. For comparison between the two groups, IgG isotypes were expressed as a proportion relative to IgG1.
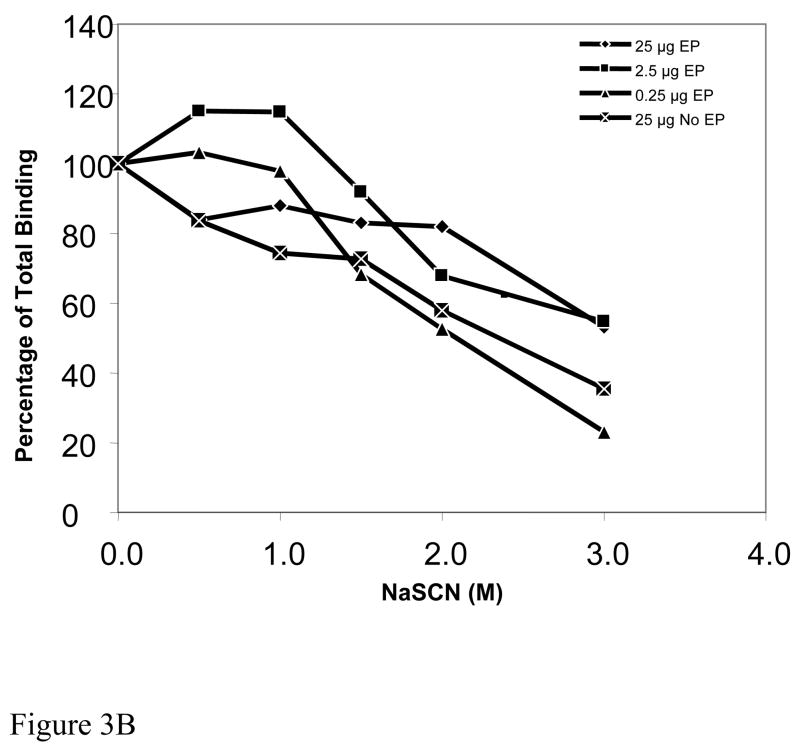
Figure 3B. Antibody avidity of sera. The plot shows the molar concentration of NaSCN required to reduce antigen-antibody binding. Zero molar NaSCN is the baseline avidity and is represented on the plot as 100 percent total binding. Pooled mice sera from the four groups are identified by the following symbols: 25μg EP [filled diamond], 2.5μg EP [filled square], 0.25μg EP [filled triangle], 25μg No EP [X in square].


