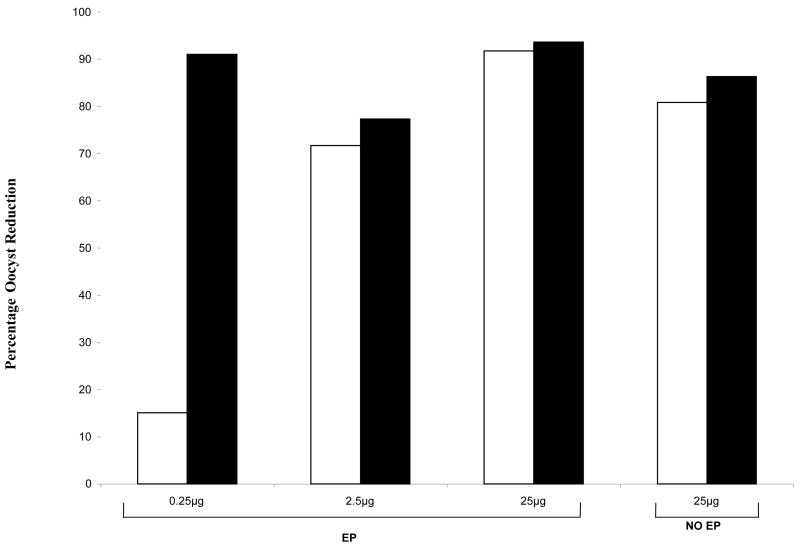
Figure 4.
Membrane Feeding Assay comparing percentage oocyst reduction after a prime and one boost [white bars] or a prime and two boosts [filled bars]. Pooled sera were tested at 1:2 dilution and the percentage oocyst reduction was calculated as discussed in materials and methods section. Three of the four groups of mice received EP [EP] and one group did not receive EP [No EP]. The doses of DNA administered to each group are indicated on the horizontal axis.

