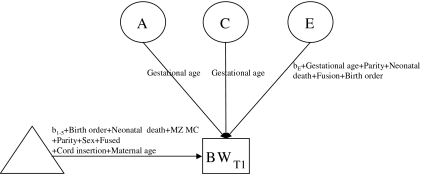
Fig. 2.
Partial path diagram of the full model shown for one twin only. For the estimates and interactions, see table 1 the adjusted model. BWT1 = Birth weight twin 1, Circle = latent variables, square = measured variables, triangle = definition variables in the means model, MZ MC = monozygotic monochorionic, A = additive genetic effects, C = effects of common environment, E = effects of unique environment

