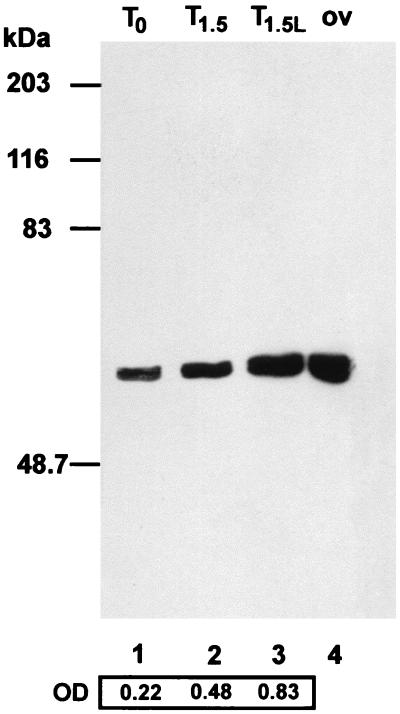
Figure 2.
Western blot analysis of proteins extracted from untreated oocytes at T0, time corresponding to GVBD (lane 1), and from untreated (T1.5) and CLβL-treated oocytes (T1.5L) 90 minutes after GVBD (lanes 2 and 3). An anti-hsp70 antibody was used. As a control, a sample of protein extracted from ovary (ov) is shown in lane 4. Hsp70 increase was quantitated by densitometric analysis of the autoradiograph. Molecular size standards are indicated on the left (in kilodaltons).

