Fig. 5.
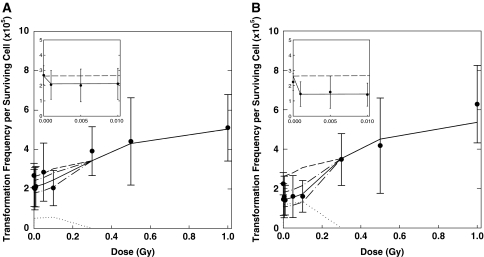
Transformation frequency for CGL1 cells irradiated with γ-radiation [45]. Error bars represent 95% CI. a Data for immediate plating and SVM fit showing the three different contributions (dash line direct, dotted line bystander, solid line total). The direct contribution relates to a model fit with kap = 0 to control and high dose data for delayed and immediate plating [51]. The contribution of the bystanders was calculated as the difference between the direct and the total contribution. b Data for delayed plating and SVM fit showing the three different contributions (dash line direct, dotted line bystander, solid line total). For the SVM fits denoted as “total”, the 95% CI are shown for the low doses (dash–dot). Insets low-dose range with the x-axis units in Gy (reproduced from Schöllnberger et al. [51])

