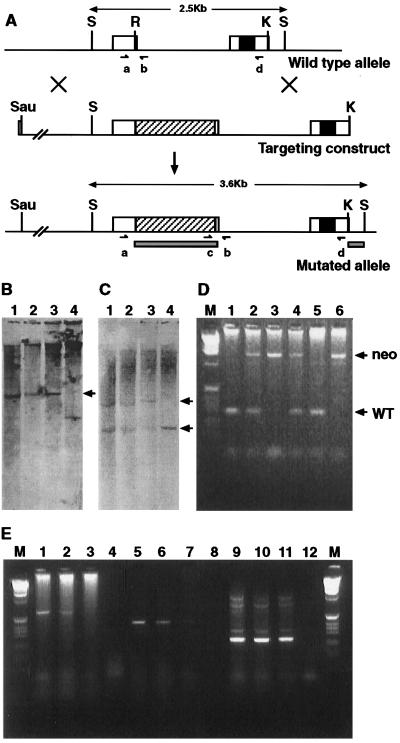
Figure 1.
Diagrammatic representation of the genomic organization and analysis of the targeted mutation. (A) Top line shows the Bapx1 genomic organization, the open boxes representing the two exons, the filled-in box the homeobox. The middle line is the targeting construct, an approximate 7-kb fragment. The diagonally hatched bar shows the location of pMC1neo-polyA at the RsrII site. The bottom line represents the genomic organization after correct targeting. The solid bars show the position of the two probes used for Southern blot analysis, and the oligonucleotides used for genotyping are represented by a, b, c, and d. Abbreviations for restrictions sites are: S, SacI; R, RsrII; and K, KpnI. (B and C) Southern analysis of four ES cell clones after digestion with SacI. B was probed with the pMC1neo-polyA probe, and lanes 1, 2, and 3 show the expected 3.6-kb band (arrow) for the correctly targeted allele, and 4 shows the incorrectly targeted control. C was probed with the 3′ probe, external to the targeting construct (the right hand solid box in A). All four lanes show the wild-type 2.5-kb band (bottom arrow), whereas only lanes 1, 2, and 3 show the additional 3.6-kb band generated from the mutated allele (top arrow). D shows the results of PCR genotyping on the yolk sacs from a number of F2 progeny from a heterozygous intercross. The primers used are marked as a and b in Fig. 1A. These give rise to a 280-bp fragment from the wild-type allele (arrow marked WT) and 1.4 kb from the mutated allele (arrow marked neo). Thus the genotypes of the embryos are: lane1 +/+; lane 2 +/−; lane 3 −/−; lane 4 +/−; lane 5 +/+, lane 6 −/−. Analysis of expression from the mutant allele is shown in E. Embryonic RNA samples used were wild type in lanes 1, 5, and 9; Bapx1+/− in lanes 2, 6, and 10, and Bapx1−/− in lanes 3, 7, and 11. The no-RNA controls are in lanes 4, 8, and 12. Lanes 1–4 are reverse transcription–PCR products from 5′ of the neo insertion (primer a) to 3′ of the homeobox (primer d) and show no full-length transcripts in the Bapx1−/− track (lane 3). Lanes 5–8 use primers 3′ of the neo insertion to 3′ of the homeobox (primer d) and show reduced levels of transcription in the Bapx1−/− track (lane7). Lanes 9–12 show the product from the hypoxanthine phosphoribosyltransferase control primers.

