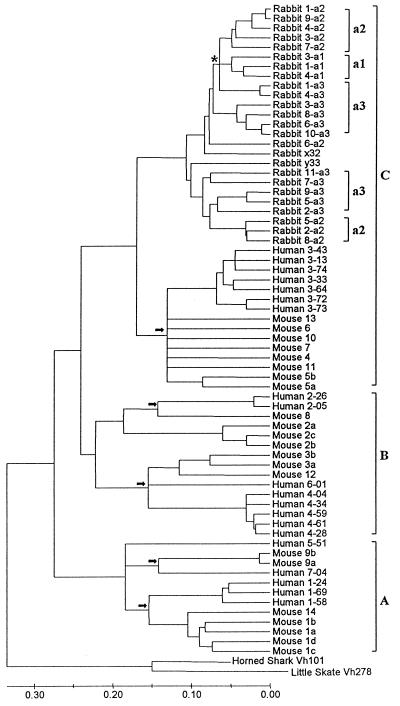
Figure 3.
Linearized tree constructed under the assumption of a molecular clock for the same VH genes shown in Fig. 2. The arrows indicate the time of divergence of the putatively orthologous human and mouse VH lineages. The asterisk (*) near the top indicates the node corresponding to the divergence of three rabbit VH1 alleles. The scale at the bottom is nucleotide substitutions per site.

