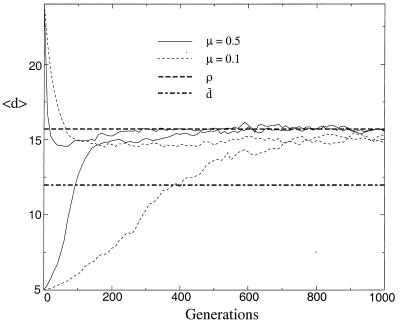
Figure 2.
The evolution of RNA mutational robustness: convergence of the population’s average neutrality to the theoretical value, 〈d〉 = ρ ≈ 15.7, predicted by the spectral radius of G (upper dashed line). The network’s average neutrality d̄ is represented by the lower dashed line. Simulations used a population size of M = 104 and mutation rates of μ = 0.5 and μ = 0.1 per sequence. Simulations were started at sequences with either a relatively large number of neutral neighbors (ds = 24) (upper curves for each mutation rate) or a small number (ds = 5) (lower curves).

