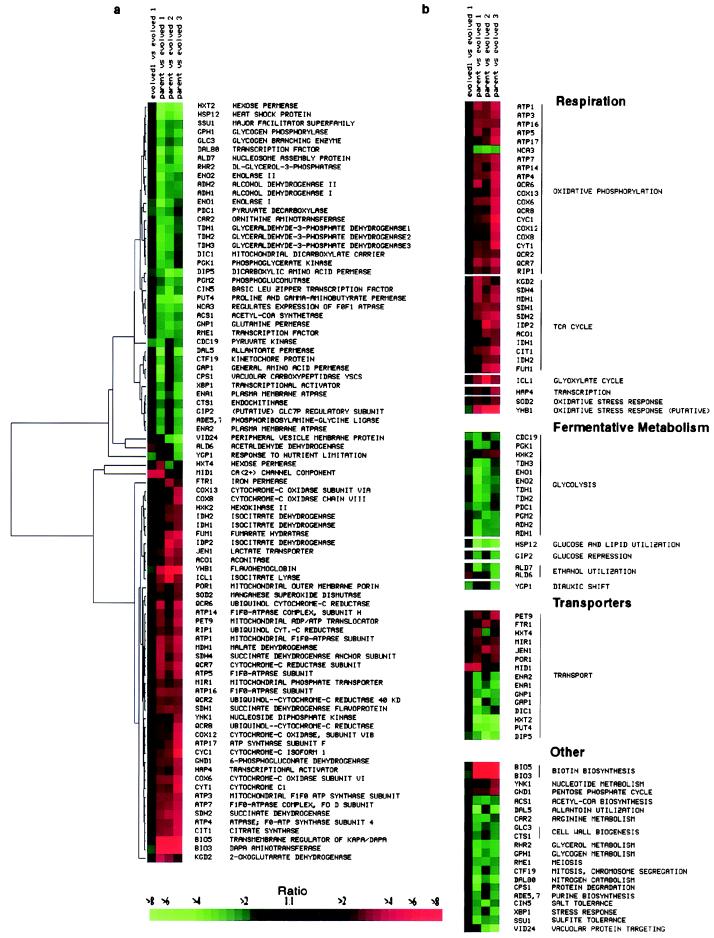
Figure 1.
Graphical representations of the differences in transcript abundance between the evolved strains and the parental strain for the 88 functionally characterized genes whose transcripts differed by at least 2-fold on two or more microarrays. The ratio of transcript levels in the evolved strain compared with the parental strain, measured for each gene, is represented by the color of the corresponding box in this graphical display (see scale). Red represents a higher level of expression in the evolved strain, and green represents a higher level of expression in the parental strain. The color saturation represents the magnitude of the expression ratio, as indicated by the scale at the bottom of the figure. Black indicates no detectable difference in expression levels; gray denotes a missing observation. (a) Hierarchical clustering of gene expression. Relationships in expression patterns among the genes are represented by the tree at the left of the display, with branch lengths indicative of the magnitude of the differences between gene expression patterns (16). (b) Expression patterns organized according to functionally defined categories.

