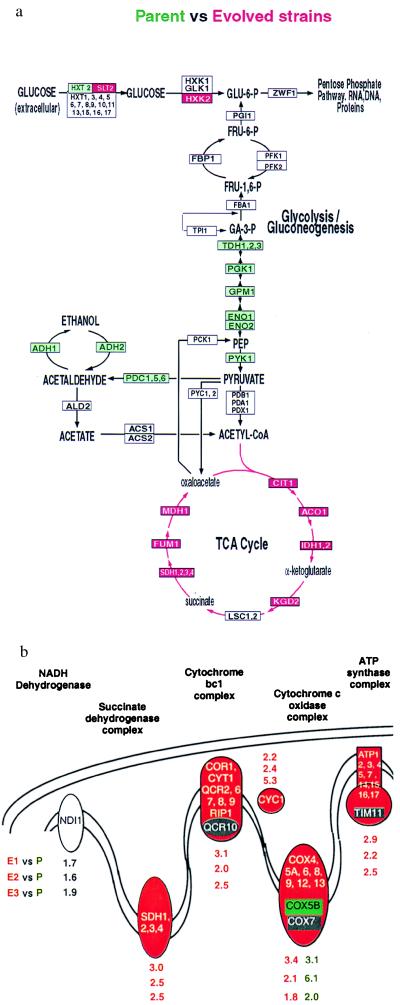
Figure 2.
(a) Alterations in gene expression consistent in two or more experiments are projected onto metabolic maps of central carbon metabolism. Increases (red) and decreases (green) of 2-fold or greater in transcripts encoding the enzymes that mediate the steps in these pathways are represented by the color of the corresponding box. (b) Average expression ratios for sets of genes encoding the mitochondrial protein complexes involved in oxidative phosphorylation. The expression ratios for COX5B, the differentially expressed isozyme of COX5A, are indicated separately from the other components of cytochrome c oxidase complex.

