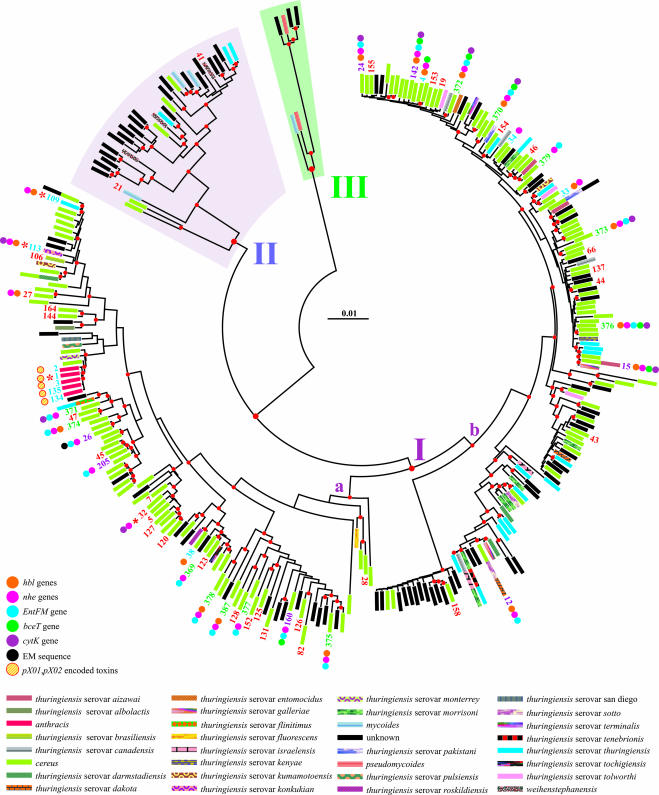
FIG. 1.
Phylogeny of the B. cereus group. An NJ tree depicts the phylogenetic relationships among unique MLST isolates. The scale bar shows the distance calculated according to the Tamura and Nei evolutionary model. Major clusters are numbered arbitrarily I, II, and III. Nodes supported by bootstrap values of >50% are marked with a red dot. Different toxin genes and species are labeled according to the self-explanatory color scheme listed below the tree. ST labels defining isolates were omitted to avoid overcrowding. Exceptions are represented by newly determined unique isolates (green), new isolates with a counterpart in the public database (purple), food-borne isolates (red), and public isolates (blue), for which toxin data are available in the literature. The distribution of toxins and toxin genes is not known for most of the food-borne isolates labeled here. The distribution of toxins and toxin genes is also currently unknown for the unlabeled STs depicted in this figure. An ST marked with a red asterisk indicates that at least a full-length genome sequence is available in GenBank for an isolate with the same ST profile.

