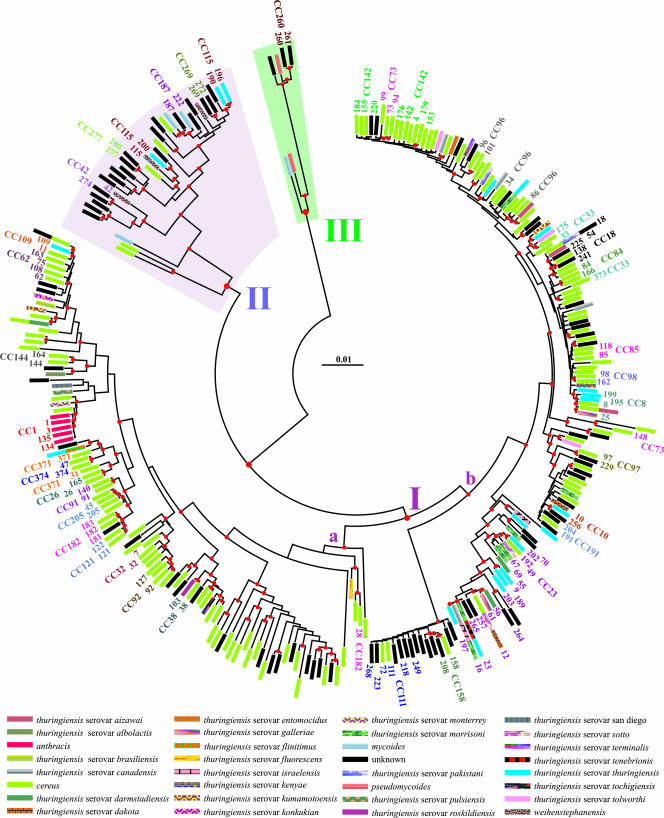
FIG. 3.
Distribution of potential CCs, identified by eBurst analysis, on the NJ tree. The scale bar indicates distance calculated according to the Tamura and Nei evolutionary model. The 35 complexes of ST profiles obtained through eBurst analysis were mapped on the phylogenetic tree previously produced with MEGA program. The species legend listed below the tree is identical to that provided in Fig. 1. Numbers at the tip of the tree terminal branches refer to the corresponding ST profiles labeled according to the scheme provided in the MLST database dedicated to B. cereus (http://pubmlst.org/bcereus/). CCs are labeled according to the eBurst results (see the supplemental material).

