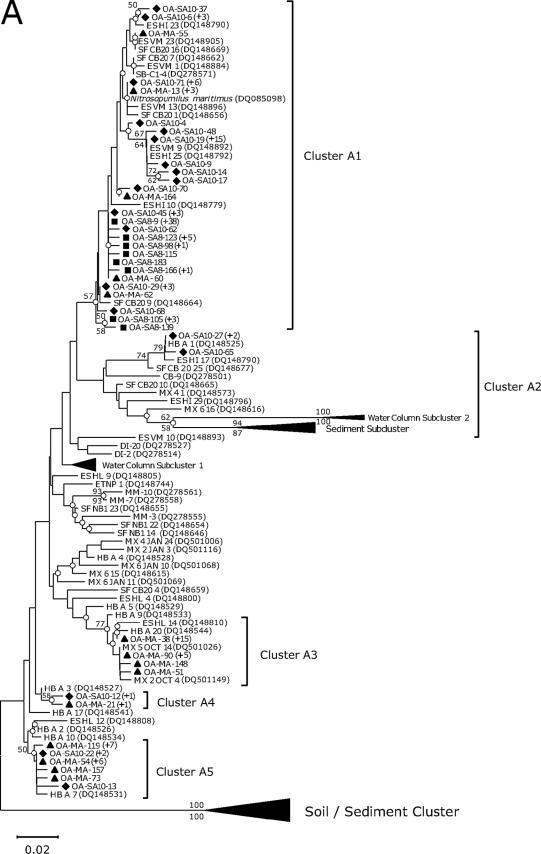
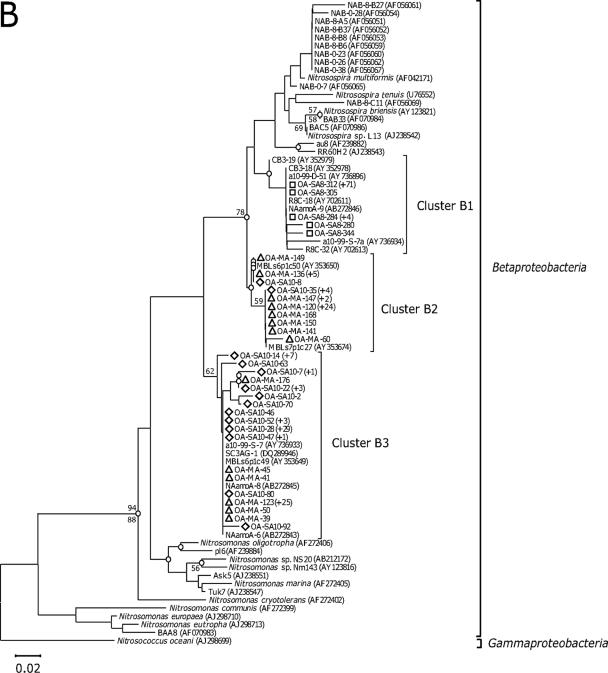
FIG. 1.
Neighbor-joining trees show phylogenetic relationships among archaeal amoA (A) and bacterial amoA (B) sequences recovered from aquarium biofiltration systems. The clone sequences reported in this study are coded by symbol according to the fish tank sampled (i.e., diamond, coastal fish tank; square, cold-water tank; and triangle, ocean sunfish tank). The number of sequences showing identical amino acid sequences is indicated by values in parentheses. The branch nodes supported by two phylogenetic analyses (neighbor joining [NJ] and maximum parsimony [MP]) are indicated as open circles. Numbers at branch nodes are bootstrap values obtained from NJ (above the branch) and MP analyses (below the branch); only value nodes supported by bootstrap values greater than 50% and those which are important for defining the phylogenetic major groups are indicated. For outgroups, a soil/sediment cluster, proposed by Beman and Francis (1), and Nitrosococcus oceani are used, respectively, for the AOA and AOB trees. The bar represents 0.01 estimated substitution per site. The archaeal amoA gene, which corresponds to 198 amino acids, and the bacterial amoA gene, which corresponds to 150 amino acids, were used for phylogenetic analyses. A distance matrix was inferred by using a pairwise difference method to construct a phylogenetic tree based on the amino acid alignments. NJ trees based on the Jones-Taylor-Thornton matrix as an amino acid replacement model and MP trees were constructed based on alignments of amino acid sequences. Distance-based and parsimony-based bootstrap analyses were conducted and used to estimate the reliability of phylogenetic reconstructions with 500 replicates for both archaeal and bacterial amoA sequences.


