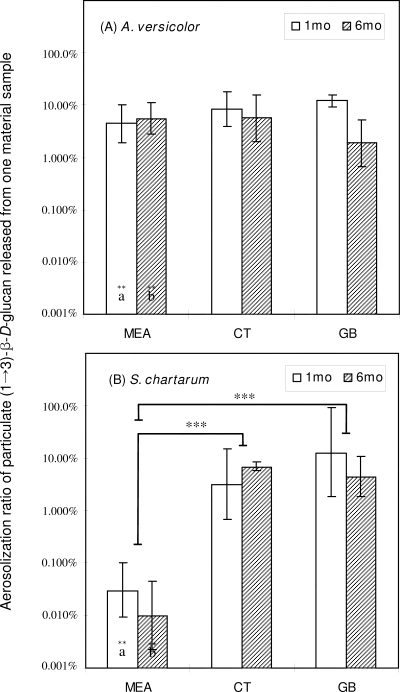
FIG. 5.
Aerosolization ratio for particulate (1→3)-β-d-glucan (BGairborne/BGsurface × 100) released from the surfaces of material samples during 3 min. CT, ceiling tile; GB, gypsum board. (A) A. versicolor; (B) S. chartarum. The bars indicate geometric means, and the error bars indicate the geometric standard deviations of three trials. Significant differences between the two species are indicated by letters (identical letters indicate a significant difference). Solid lines indicate that geometric means for incubation periods and material samples are significantly different. Asterisks indicate the level of statistical significance (two asterisks, P < 0.01; three asterisks, P < 0.001).

