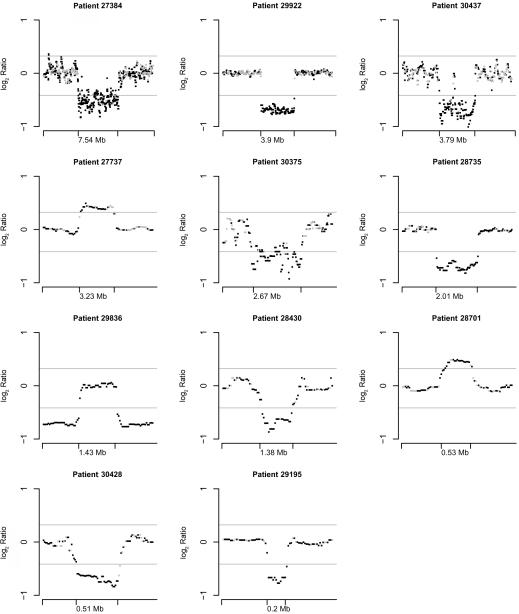
Figure 2. .
Genomic profiles showing the log2 intensity ratios of CNVs and of the surrounding genomic regions detected in patients with MR. The length of the CNVs is indicated on the X-axis. log2 Intensity ratios are calculated as described in the “Material and Methods” section. Displayed are the log2 intensity ratios after median smoothing with a window of 9. The dosage values of homozygous and heterozygous SNPs are depicted in black and gray, respectively. The gray horizontal lines are drawn at log2(0.75) and log2(1.25).

