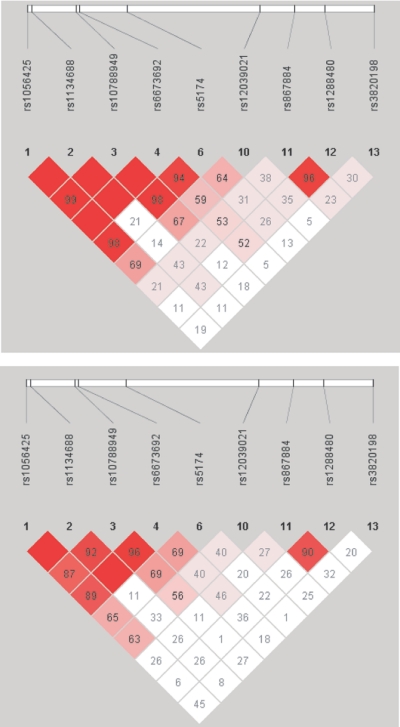
Figure 2. .
Pairwise LD analysis. LD between SNPs in LRP8, including R952Q (rs5174), and SNPs in two nearby genes (rs6673692 and rs10788949 in MAGOH and rs1134688 and rs1056425 in FLJ20580) was derived from genotyping data from the GeneQuest control (top) and MI (bottom) populations. LD for the CAD population was nearly identical to the MI population (data not shown). The pairwise correlation between SNPs was measured as D′ and is shown (×100) in each diamond. The red-to-white color gradient indicates the magnitude of pairwise LD, ranging from higher to lower values of LD.

