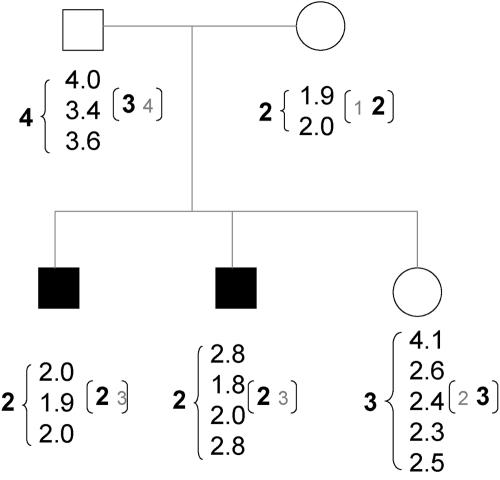
Figure 2. .
One selected U.K. family. Blackened symbols represent individuals affected with asthma. The column of numbers below each individual lists the replicate CNP assay measure for each. The number to the left of the column represents the integer (closest to the mean) assignment. The numbers to the right in parentheses reflect the most likely (in larger, bold type) and the next most likely underlying phenotype taken from the marginal posterior probability for each individual.

