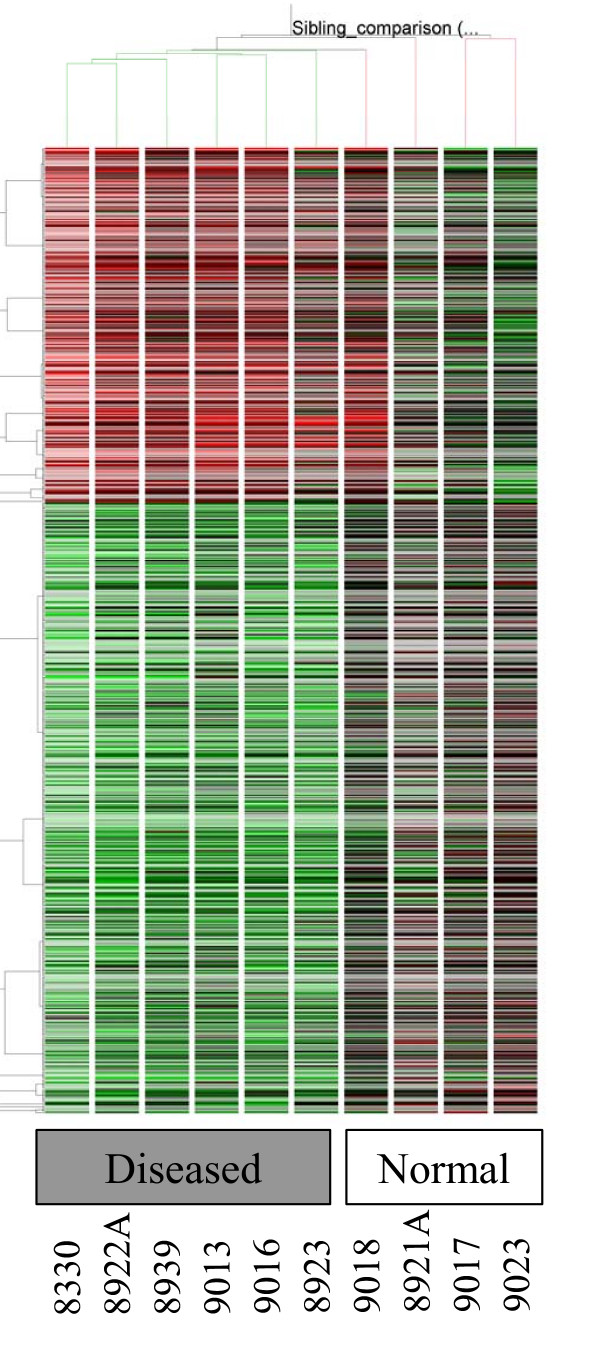
Figure 1.
Hierarchical clustering of all statistically significant genes that show differential expression between diseased and normal samples. Upregulated are colored red and downregulated genes are colored green. Clustering of genes is shown on the left while condition based tree is shown on the top.

