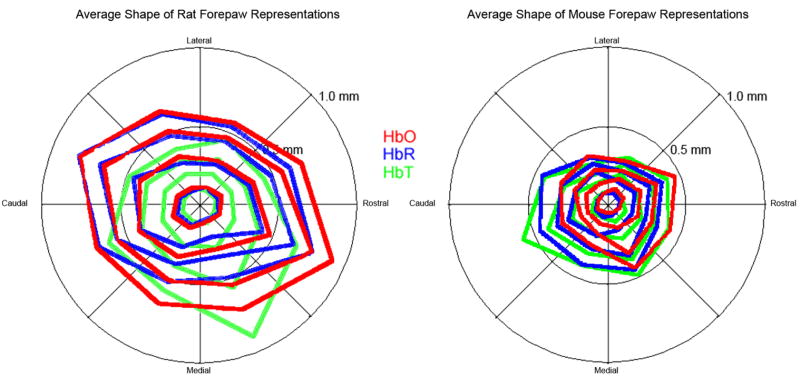
Figure 5. Shape of hemodynamic changes during neurovascular coupling in rat versus mouse.
In rat S1 cortex (left), HbO (red) and HbR (blue) maps of the forepaw had similar sizes and shapes, whereas HbT maps were on average more distorted due to signal from surface veins and arteries. In mouse S1 cortex (right) all three forepaw maps had similar topographic shapes.

