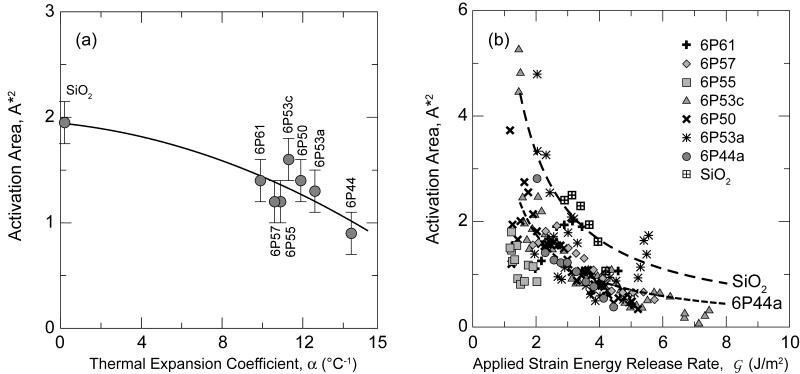
Figure 6.
(a) Plot showing a decline of activation area for crack growth versus CTE of the glass, indicating indirectly that the parameter A* decreases with increasing reactivity of the glass caused by higher alkali and alkaline earth oxide contents. (b) Dependence of the activation area with , according to the data shown in Fig. 2. The lines are theoretical boundaries ( ) taking m from the fittings summarized in Table 2.

