
Fig. 11.
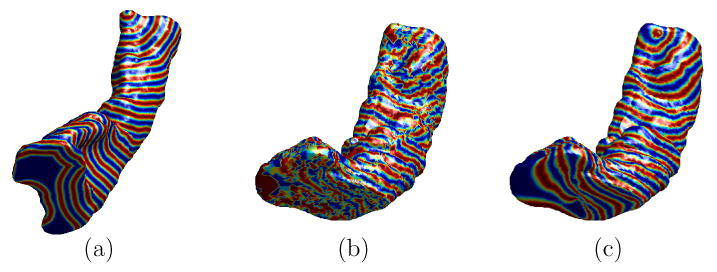
Visualization of mapping results. (a) The zebra pattern on the high resolution source surface. (b) Projection of the zebra pattern onto the high resolution target surface using the initial map. (c) Projection of the zebra pattern onto the high resolution target surface using the final map computed from minimizing the harmonic energy under landmark constraints.