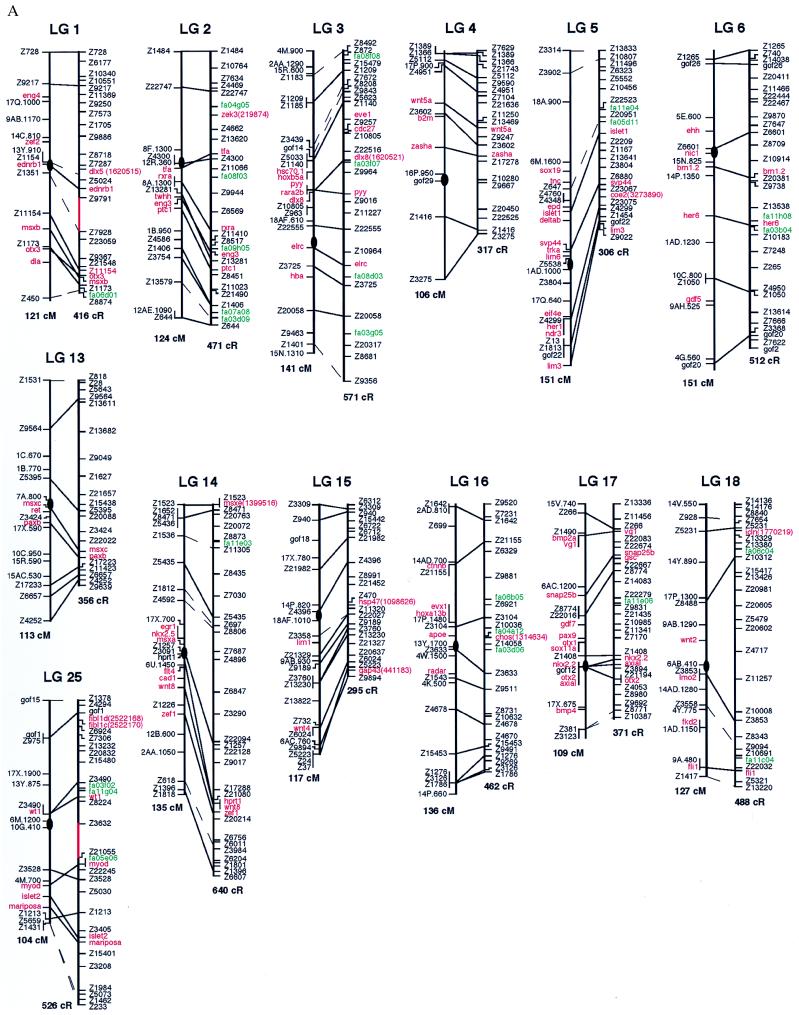
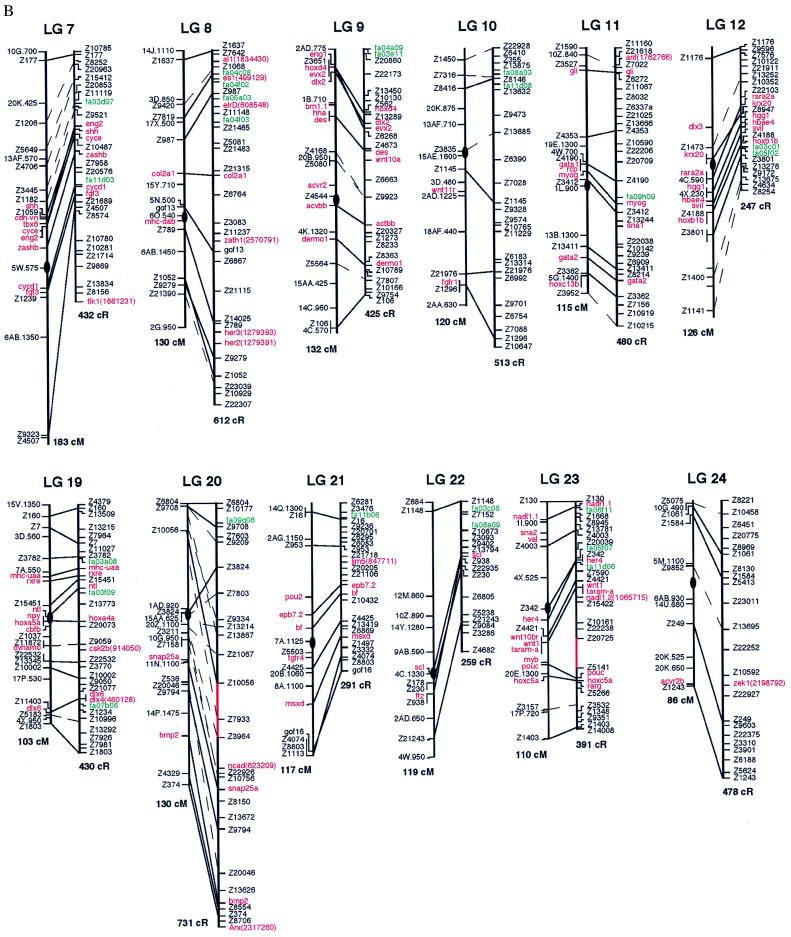
Figure 1.
Comparison of RH and meiotic maps. For each linkage group (LG), the meiotic map is on the left and the RH map is on the right. Solid lines connect the same marker placed on both maps; dashed lines connect markers that fall into the same high-confidence bin. Markers depicted in black are SSLP markers, markers in red are cloned genes, and markers in green are ESTs. Below the map of each LG is the total distance estimate, in centiMorgans (cM) for the meiotic maps and cR for the RH maps. Four gaps remain on the RH maps, regions not linked at lods of five or higher; these gaps are depicted in red (LG 1, 20, 23, and 25). All placement markers are italicized. (Figure continues on opposite page.)


