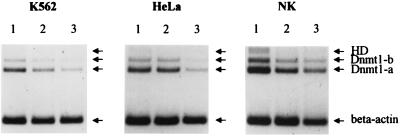
Figure 4.
Relative expression of Dnmt1-a and Dnmt1-b in total RNAs from K562, HeLa, and NK cells. The analysis was performed as described in detail in Materials and Methods. HD indicates the band resulting from heteroduplex formation between Dnmt1-b and Dnmt1-a during the PCR cycles (data not shown). The RT-PCR samples loaded were derived from 10 ng (lanes 1), 5 ng (lanes 2), and 2.5 ng (lanes 3) of total RNA.

