
Figure 3.
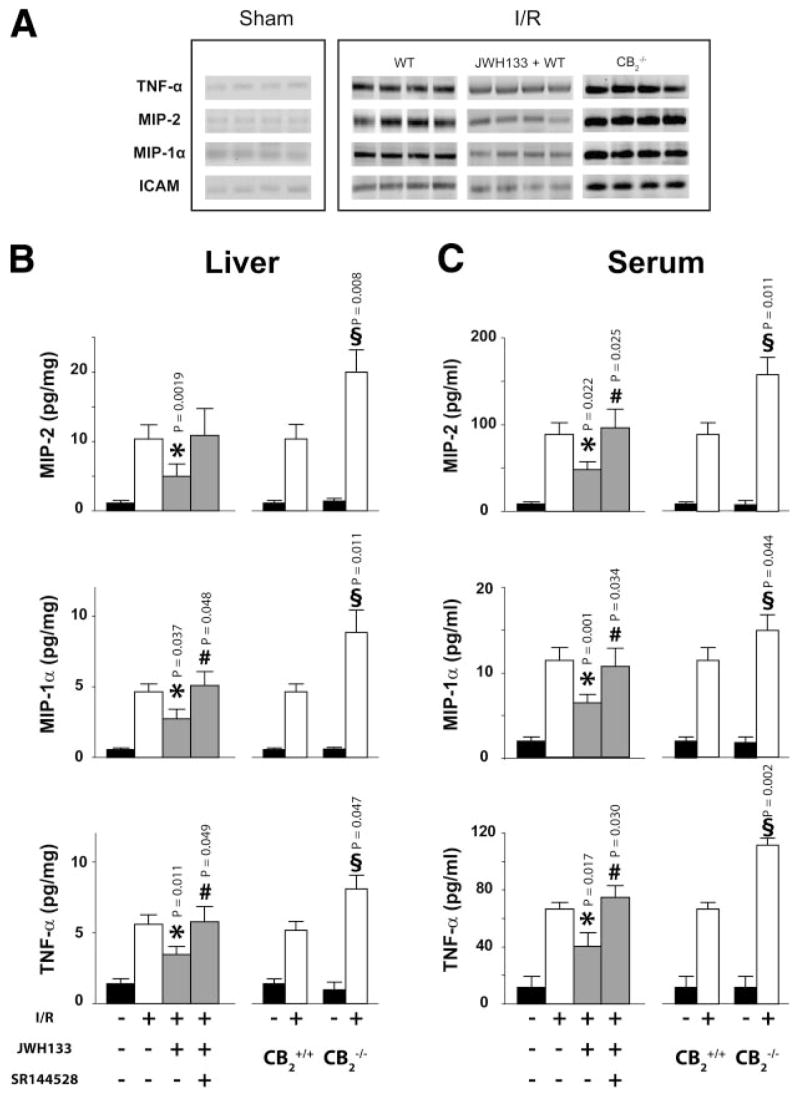
CB2 receptor agonist decreases proinflammatory markers in serum and liver. A) TNF-α, MIP-2, MIP-1α, and ICAM-1 expression detected by RT-PCR (n=4). B, C) MIP-2, MIP-1α, and TNF-α levels in liver tissue and serum, measured by ELISA. Left: Sham (n=10) or 60/90 min I/R-exposed mice pretreated with vehicle (n=12), JWH133 (20 mg/kg, n=8), or SR144528 (3 mg/kg) in combination with JWH133 (n=10). Right: Sham CB2+/+ (n=6) and CB2−/− (n=5) mice or CB2+/+ (n=11) and CB2−/− (n=13) mice exposed to 60/90 min I/R. (*P<0.05: I/R in vehicle- vs. JWH133-treated; #P<0.05: I/R in JWH133- vs. SR144528+JWH133-treated; §P<0.05: IR in CB2−/− vs. CB2+/+).