
FIG. 1.
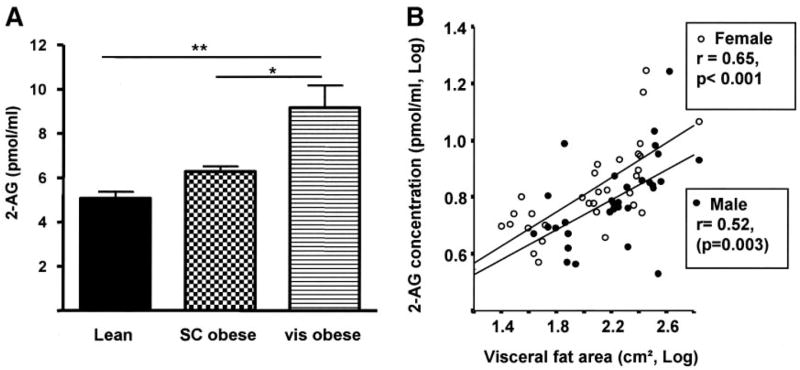
Circulating 2-AG concentrations in lean and obese subjects. Circulating 2-AG concentrations were measured in one lean control group (BMI <25 kg/m2, n = 20) and in two obese groups (BMI >30 kg/m2) with different fat distribution phenotypes. Fat distribution was determined by measurement of abdominal adipose tissue areas using computed tomography. Subjects were divided in visceral (vis) obese (n = 20) or subcutaneous (SC) obese (n = 20) groups. A: 2-AG is clearly increased in subjects with visceral obesity. No sex differences were found for plasma 2-AG concentrations in the three groups. B: In both men and women, circulating 2-AG concentrations correlate with abdominal visceral fat area as measured by computed tomography scans. Data are means ± SE. *P < 0.05, **P < 0.01 by ANOVA.