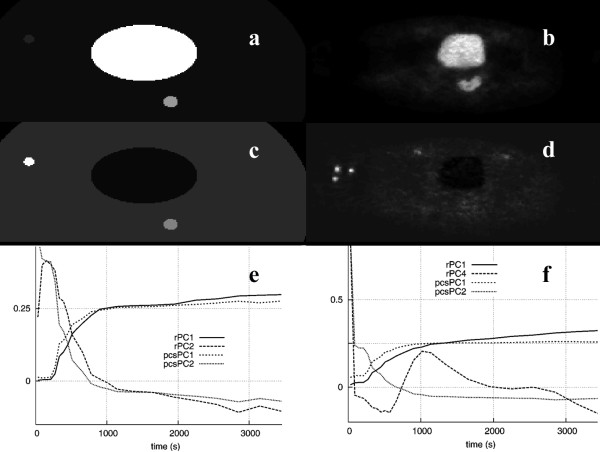
Figure 3.
Image PCI1 (a) and image PCI2 (c) of the phantom study and the PCs (e) calculated using the raw data (rPC), and after applying the PCS preprocessing technique (pcsPC). Also shown are image PCI1 (b) and image PCI2 (d) of the corresponding clinical study calculated using the PCS preprocessed data and PCs (f) for both the raw and the PCS-transformed data.

