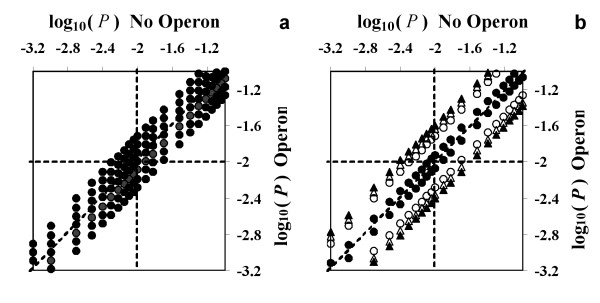
Figure 4.
Relationship between the probability of identical expression in both samples, P, without operon information and with operon information. Dashed lines represent the diagonal of equality and the value of P = 0.01 in both axes.(a) Effect of the transcriptional pattern on P. The plot represents the case in which the gene in study is up-regulated in sample 1 and belongs to an operon with 6 more genes from which 0, 1, 2, 3, 4, 5 or 6 are up-regulated in sample 1 (lines from top to bottom). (b) Effect of the operon size on P. The most extreme transcriptional pattern is represented: the gene in study is temporally classified as equally (or differentially) transcribed and the rest of the genes in the operon are classified as differentially (or equally) transcribed. Different operon sizes, 1 (●), 6 (0), 12 (△) and 24 (▲) genes, are considered.

