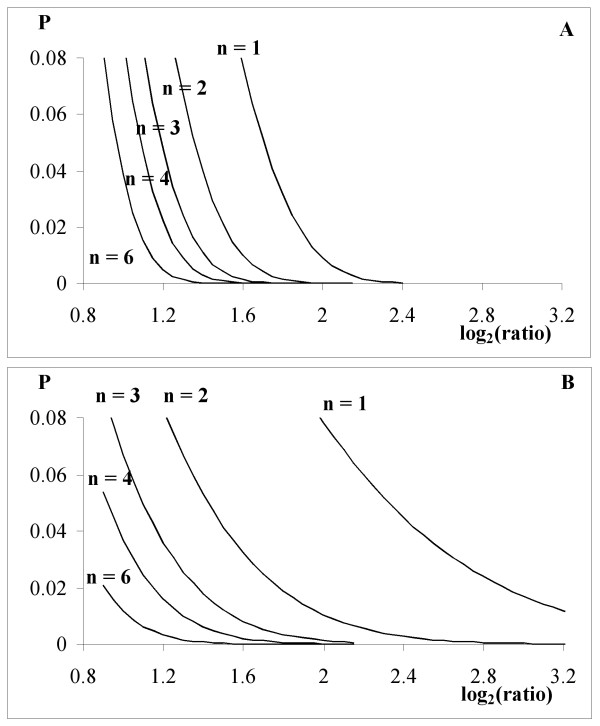
Figure 5.
Effect of the assumed distribution, A) Gumbel or B) Gaussian, for the log of the ratio and of the number of replicates on the posterior probability of identical expression, P. The plots represent the case in which the expected value of the log2 (ratio) for genes identically transcribed in both samples is 0 and their variance equal to 1. The number of replicates (n) varies from 1 to 6.

