
Figure 2. Adaptation phase results.
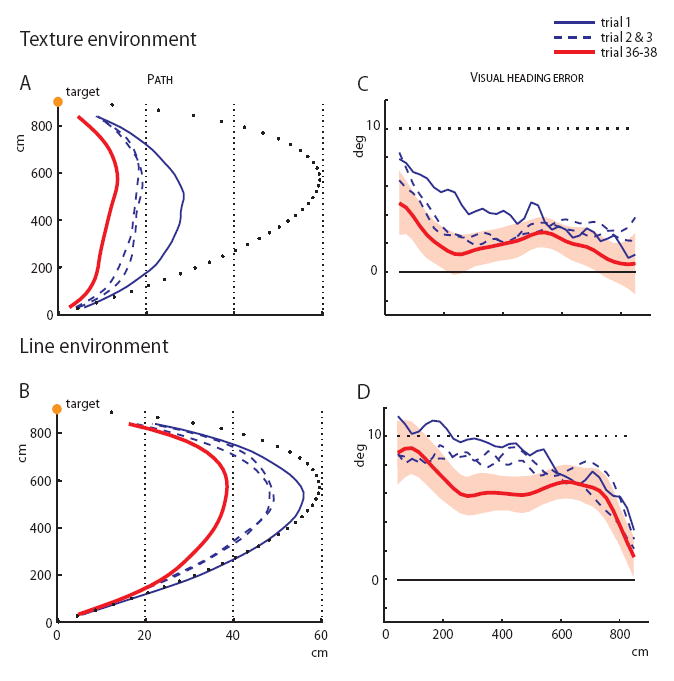
(A, B) Plan view of walking paths in the Texture and Line environments, showing the mean paths for the first three adaptation trials (blue curves) and the mean of the last three trials (red curve). Dotted curve (black) is the prediction of the egocentric direction strategy, Y-axis corresponds to the prediction of the optic flow strategy.
(C, D) Mean virtual heading error as a function of distance in the Texture and Line environments. Dotted line is the egocentric direction prediction, solid line is the optic flow prediction; shading corresponds to the 95% confidence interval for the last three trials based on between-subject variability.