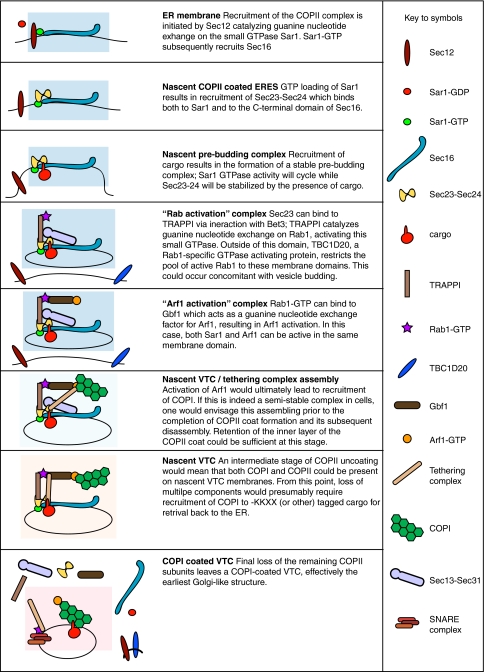
Fig. 2.
Schematic model for COPII–COPI coupling. The model shows the assembly and putative coupling of COPI and COPII function in mammalian cells. Starting from the top, the model shows the early stages of assembly of the COPII complex, dependent on Sar1 and Sec16 function. The blue box indicates events at the ERES and the protein components are labelled as detailed in the legend. This model is based on published work and includes known interactions. What is unclear is precisely how many of these interactions occur together i.e. just how large the complexes/subcomplexes can get. For example, we have no real idea whether there is a point at which Sec16 and COPI can be present on the same membrane/vesicle. Sec16 is drawn as part of the budded vesicle as the true fate of Sec16 during the COPII assembly/budding process remains unclear. At the stage of nascent VTC/tethering complex assembly (light blue) we have suggested that Sec13/31 dissociates. This is based on observations linking Sec23/24 to multiple important components that operate post budding such as TRAPPI and dynactin. The nascent VTC stage (light yellow) precedes complete loss of the COPII components, after which one is left with a COPI-coated VTC

