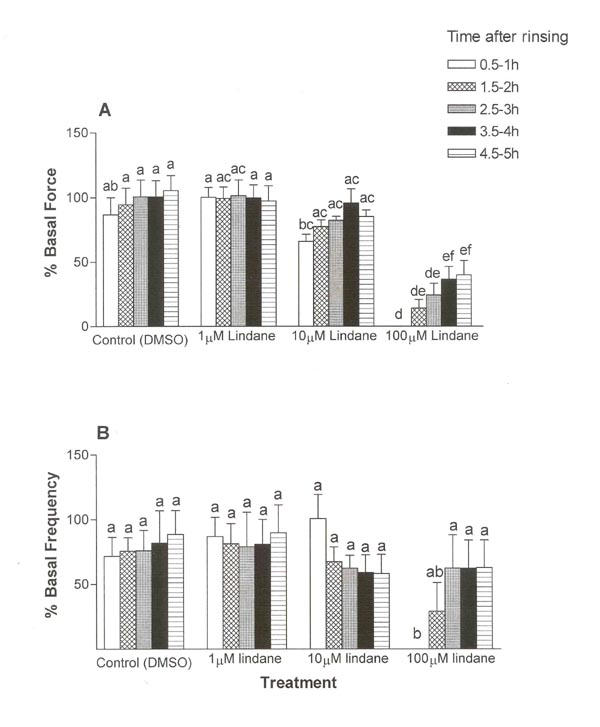
Figure 4.

Time- and concentration-related effects of lindane on contraction force (A) and frequency (B) during recovery. Uterine strips were exposed to lindane (1, 10 or 100 μM) as described in Figure 1. The average peak force of contraction and the average frequency of contraction were calculated relative to basal (pretreatment) values, as described in Methods, over 30-min intervals of a 5-h recovery period beginning 30 min after removal of the lindane exposure buffer (rinsing). Changes in contraction force and frequency were analyzed by separate repeated measures analysis of variance (ANOVA) for concentration, time, and interaction effects, with repeated measures on time. Contraction frequency and force recovered from lindane-induced inhibition in concentration-dependent and time-dependent manners, with a significant interaction between concentration and time (ANOVA, p ≤ 0.001). Vertical bars with different letters have means that are significantly different from each other in pair-wise comparisons (Student-Newman-Keuls, p ≤ 0.05). Values shown are mean ± SEM of 7 uterine strips. Error bars not visible are too small to be displayed graphically.
