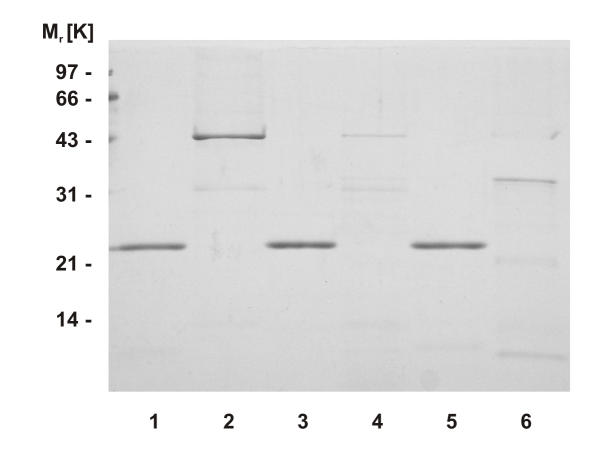
Figure 10.
aaTHEP1 consists of a single domain. SDS-PAGE after limited proteolysis by trypsin and endoproteinase Glu-C. aaTHEP1 is shown on lanes 1, 3 and 5. As a control, the β-subunit of tryptophan synthase from E. coli is run on lanes 2, 4, and 6. Lanes 1 and 2 show the native proteins without the addition of proteases. Proteolysis by trypsin is seen on lanes 3 and 4 whereas proteolysis by endoproteinase Glu-C is shown on lanes 5 and 6.

