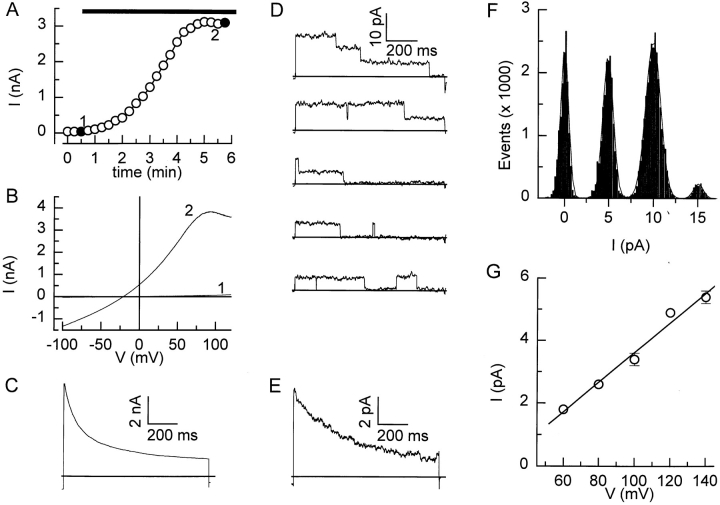
Figure 1.
Activation of I Cl,swell by hyposmotic cell swelling. (A) Activation of I Cl,swell, measured at +60 mV by superfusion of a BC3H1 cell with the normal hyposmotic solution (horizontal bar). (B) Current– voltage relations obtained at the times indicated in A. (C) Current measured after full activation of I Cl,swell during a 1-s step to +120 mV. (D) An outside-out patch pulled from a swollen cell was held at -80 mV and stepped to +120 mV for 1 s every 1.5 s. Records were sampled at 2 kHz and filtered at 0.5 kHz. Linear leak currents and capacitive currents were eliminated by subtracting blank records. The pipette solution contained Cs+ instead of K+ to avoid contamination by K+ channels. External solution was the NMDG+ solution containing 5 mM Mg2+. (E) Average current from 30 records from this patch. (F) Current amplitude histogram from the same 30 records. The dotted line represents the best fit with the sum of four gaussian functions. Single channel amplitude was 5.0 pA. (G) Single-channel current–voltage relation for the region between +60 and +140 mV. Full line represents a linear fit through the data, yielding a slope conductance of 47 pS. Data points are from two to eight different patches.

