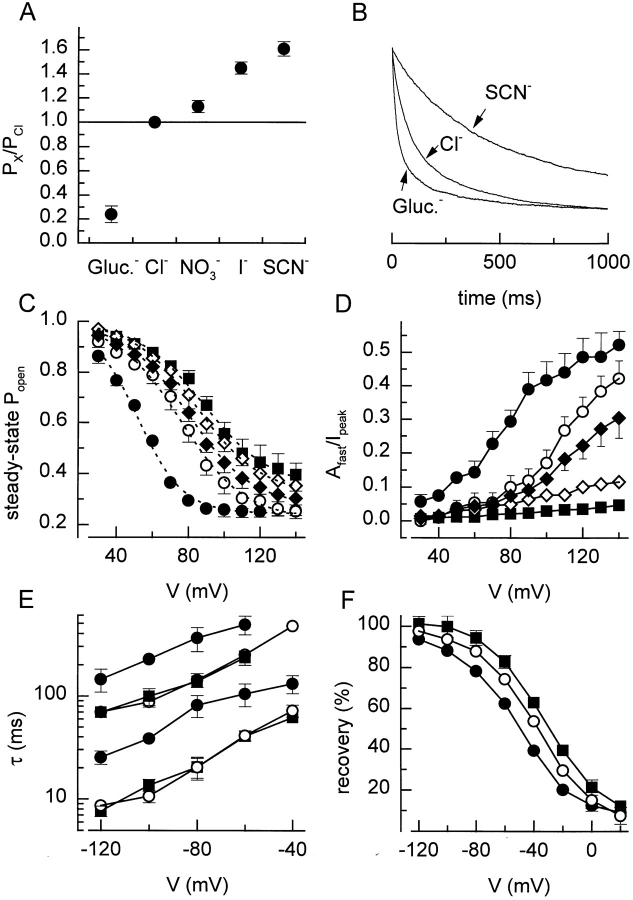
Figure 11.
Effect of anion substitution. (A) Relative permeability of the tested anions, calculated from the shifts in reversal potential. (B) Current inactivation during 1-s voltage step to +120 mV with SCN−, Cl−, and gluconate as major extracellular anions. Current traces were rescaled for better comparison. (C) Steady state inactivation curves with the five different anions. Eq. 2 fitted to the data points yielded values for V 1/2 of 52, 75, 79, 84, and 88 mV, and for k V of 12.6, 14.1, 17.9, 17.8, and 18.6 mV with, respectively, gluconate, Cl−, NO3 −, I−, and SCN−. (D) Voltage and anion dependence of the relative amplitude of the fast inactivating component. (E) Time constants for the recovery from inactivation with different external anions. (F) Effect of different extracellular anions on the recovery from inactivation after 500 ms. Symbols in C–F : •, gluconate; ○, Cl−; ♦, NO3 −; ⋄, I−; and ▪, SCN−.

