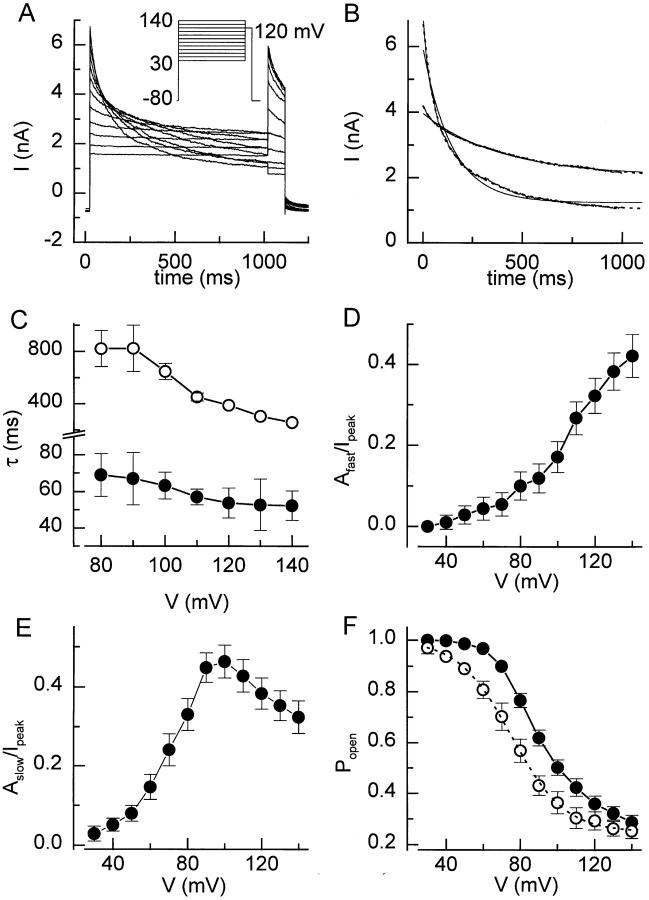
Figure 2.
Inactivation of I Cl,swell during depolarizing voltage steps. (A) The voltage protocol and resulting current traces showing inactivation of I Cl,swell during depolarizing steps. (B) The current decay during the 1-s step to +140 and +80 mV is shown together with monoexponential (solid line) and biexponential (dotted lines) fits. (C) Time constants τfast (•) and τslow (○) for the double exponential fits at the different potentials. (D and E) Voltage dependence of the relative amplitudes of the fast and slow inactivating components. (F) Popen at the end of the 1-s step (•) and steady state Popen (○). The dotted line represents the best fit with Eq. 2.

