
Figure 3.
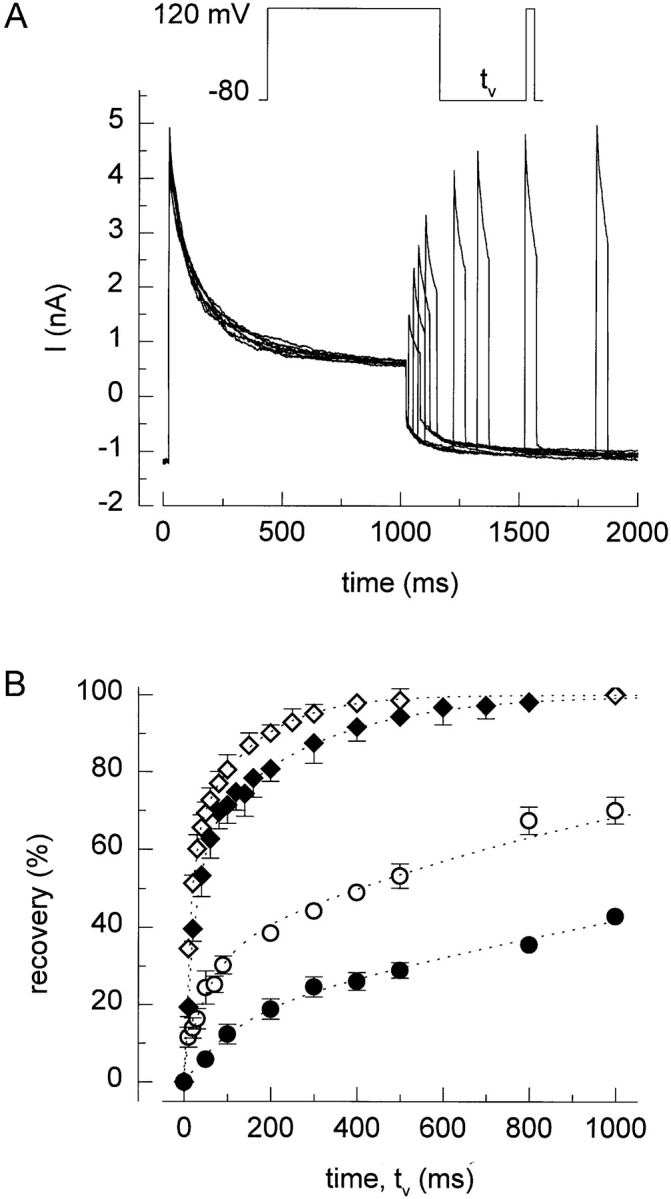
Recovery from inactivation. (A) After current inactivation during a 1-s step to +120 mV, recovery of the current increases as the duration (tv) of the voltage step to −80 mV increases. (B) Time course of current recovery at 0 (•), −40 (○), −80 (♦), and −120 mV (⋄). Dotted lines represent double exponential fit to the data points.