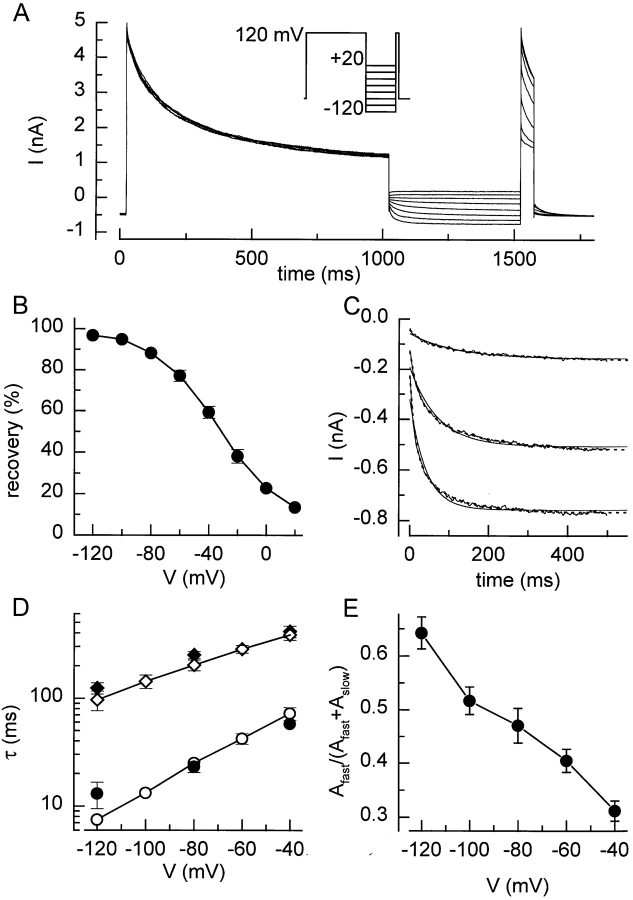
Figure 4.
Voltage dependence of recovery from inactivation. (A) Voltage protocol and current traces showing the voltage dependence of recovery from inactivation. (B) Recovery during the 500-ms step to the different voltages. (C) Current traces measured during the 500-ms step to −120, −80, and −40 mV are shown together with single exponential (solid lines) and double exponential (dotted lines) fits. (D) Values for τfast, (○) and (•), and τslow, (⋄) and (♦), obtained from fits to current traces as in Fig. 4 C (open symbols) or to the data points in Fig. 3 B (filled symbols). (E) Fractional contribution of the fast component to the recovery from inactivation.

