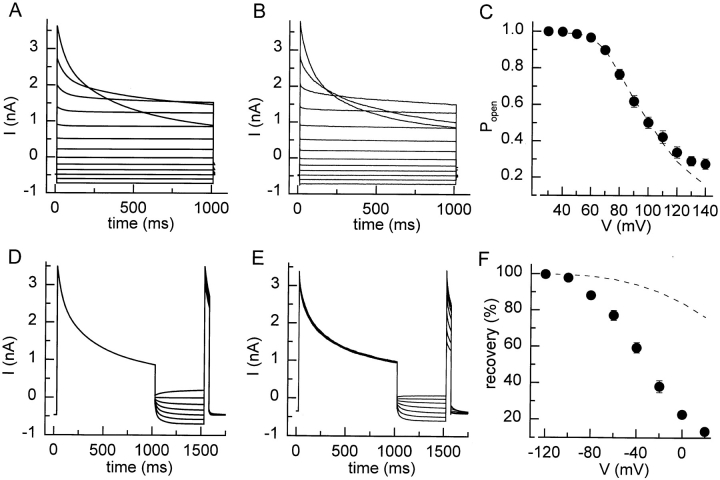
Figure 7.
Simulation of current traces. Model currents (A) and average currents from five cells (B) during 1-s voltage steps to potentials ranging from −120 to 120 mV from a holding potential of −80 mV. (C) Comparison of the predicted open probability at the end of the voltage steps (dotted lines) with the experimental data. Model currents (D) and average currents from five cells (E) obtained with the voltage protocol shown in Fig. 4 A. (F) Comparison of the predicted recovery from inactivation (dotted lines) with the experimental data.

