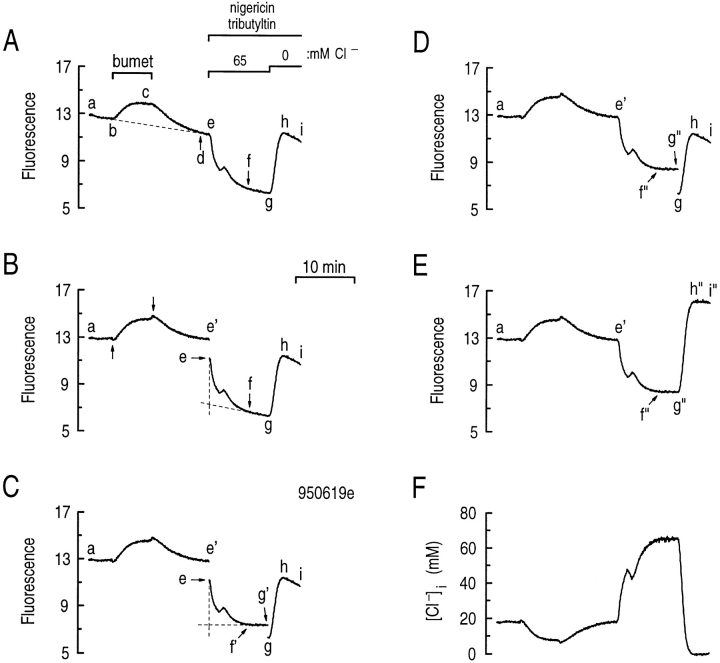
Figure 13.
A corrected MQAE fluorescence loss from hippocampal astrocytes. (A) Raw fluorescence vs. time record for the experiment shown in Fig. 3 A. During the indicated period, the astrocytes were exposed to 1 μM bumetanide (bc). At the end of the experiment, the cells were exposed to a high K+/nigericin/ tributyltin chloride calibration solution containing 65 and 0 mM Cl− (e–g and g–i, respectively). (B) Partially corrected fluorescence vs. time record. Segment ae' was obtained by using the time-dependent, ratiometric correction technique (Eq. A2) to correct for dye loss during segment a–e in A. (C) Partially corrected fluorescence vs. time record. Similarly, ef 'g' was obtained by using Eq. A2 to correct for the dye loss when the astrocytes were exposed to the 65 mM Cl− calibration solution (B, e–g). (D) Partially corrected fluorescence vs. time record. ef 'g' in C was scaled (using Eq. A3) such that ae' was continuous with e'f ”g”. (E) Fully corrected fluorescence vs. time record. Using the ratiometric correction (Eq. A2) and the scaling technique (Eq. A3) as described for segment e–g in B, g–i in D was converted into g”h”i”. (F) [Cl−]i vs. time record. The fully corrected I320 vs. time record in E was converted into the [Cl−]i vs. time record using the Stern-Volmer relationship as described in methods.

