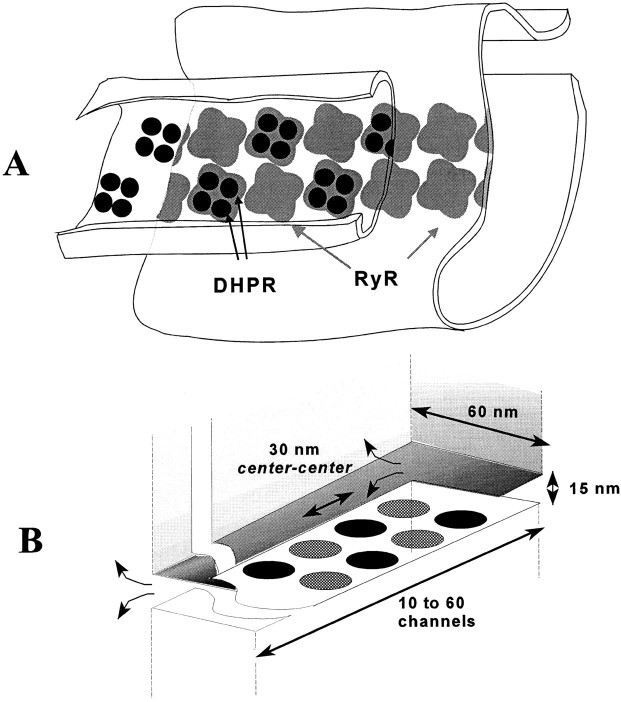
Figure 7.
(A) Relationship between voltage sensors (dihydropyridine receptor tetrads) and release channels in amphibian and mammalian skeletal muscle (modified from Block et al., 1988). (B) The idealized geometry of a couplon as used in the model. Circles represent Ca2+-releasing regions of alternating voltage controlled (V) and Ca2+ controlled (C) channels, which release Ca2+ into the junctional cleft bounded by the t-tubule membrane above and SR membrane below. Diffusion in the cleft was calculated in a two-dimensional approximation, ignoring vertical gradients. Diffusion of Ca2+ and dye across the edges of the rectangular cleft (curved arrows) was modeled by a resistive boundary condition (see Appendix). Note: dimensions in the plane of the cleft in ultrastructural data are actually 12% larger than those used in the simulation. This would correspond to a slight rescaling of the assumed diffusion coefficients.

