
Figure 1.
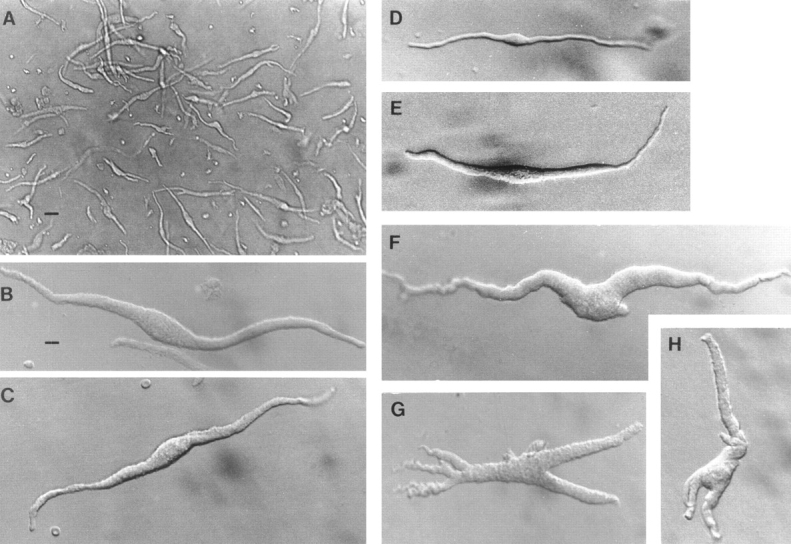
Freshly dissociated myocytes from rat uterus. Cells in C–E are in bath solution containing 3 mM Ca2+; cells in other panels are in “KB” solution (Ca2+ free). Scale bar in A represents 40 μm; that in B represents 10 μm, and applies also to all other frames. (A) Low magnification to show usual density of cells obtained from late-pregnant uteri; nonpregnant uteri will yield fewer cells. Under Hoffman modulation optics, most cells present a slight 3-dimensional appearance. Only such cells are used for this work. (B and C) Two individual myocytes from the late (18–21-d)-pregnant uterus. (D) Myocyte from a nonpregnant estrus uterus. (E) Myocyte from a mid (14-d)-pregnant uterus. Morphometric data are shown in Table I. (F–H) Myocytes showing marked pleomorphism, from swelling around midportion to arms and branches, are most frequently encountered in late pregnancy, where they may comprise ∼10% of the population (see also A). Because their complex geometry may pose problems for uniform voltage control, such cells were not used in this work.