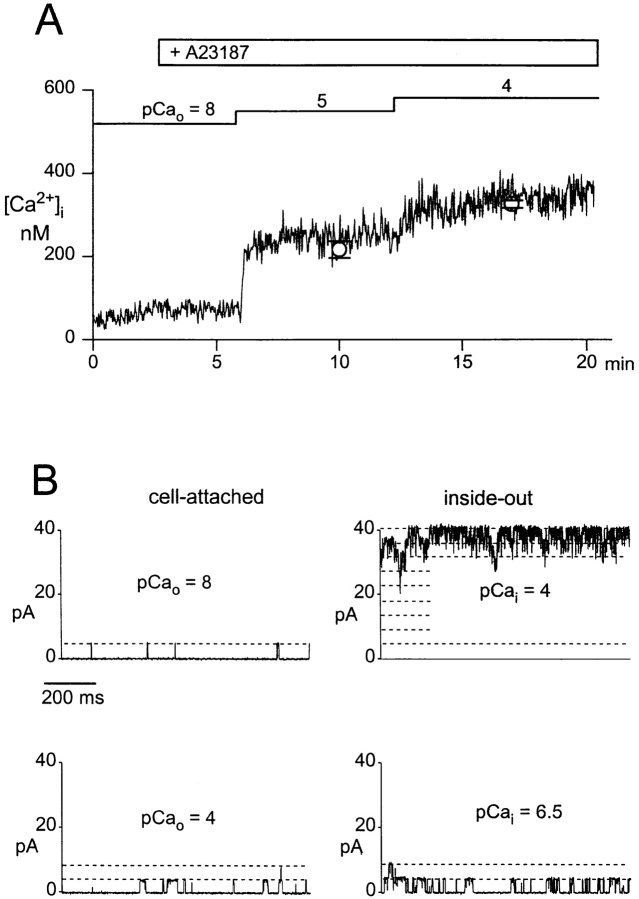
Figure 2.
Determination of intracellular Ca2+ levels during elevation of extracellular Ca2+ in the presence of A23187. (A) Time course of intracellular free Ca2+ ([Ca2+]i) during elevation of extracellular Ca2+ in the presence of 1 μM A23187 measured by fura-2 fluorescence. Administration of 1 μM A23187 and changes in the extracellular Ca2+ concentration, given as pCao values, are indicated. Mean values ± SEM (n = 7) of [Ca2+]i determined for the period of 2–4 min after elevation of extracellular Ca2+ to the respective value, are shown for pCao 5 and 4. (B, left) Activity of Ca2+-activated K+ channels in a cell-attached patch (test potential = 0 mV) during elevation of extracellular Ca2+, given as pCao values, in the presence of 1 μM A23187. (right) Channel activity in the same patch after excision (inside-out configuration) at pCa 4 (100 μM) and pCa 6.5 (300 nM). Records were filtered at 500 Hz and digitized at 2 kHz. Unitary current levels are indicated by dashed lines.

